In binary trading, price action is the analysis and interpretation of an asset’s price movement directly on a chart, without the need for a lot of indicators or other tools. Because binary trading entails making time-sensitive predictions about whether the price of an asset will move up or down within a given timeframe, it is one of the most widely used tactics for binary options traders.
The study of an asset’s price changes on a chart is known as price action. Traders examine how the price moves up or down, creates patterns, or responds to specific levels like support (where the price tends to stop falling) and resistance (where the price tends to stop rising) rather than utilizing technical indicators.
To put it briefly, price action is simply observing and interpreting price behavior to make trading decisions. It’s similar to reading a narrative straight from the chart.
How to Predict and Analyze Price Action?
To predict and analyze price action, you focus on how prices move on a chart and look for patterns, trends, and key levels. Here’s how you can do it step-by-step:
Understand the Basics of Price Movement
Prices move because of supply (selling pressure) and demand (buying pressure).
Identify if the market is trending up, trending down, or moving sideways.
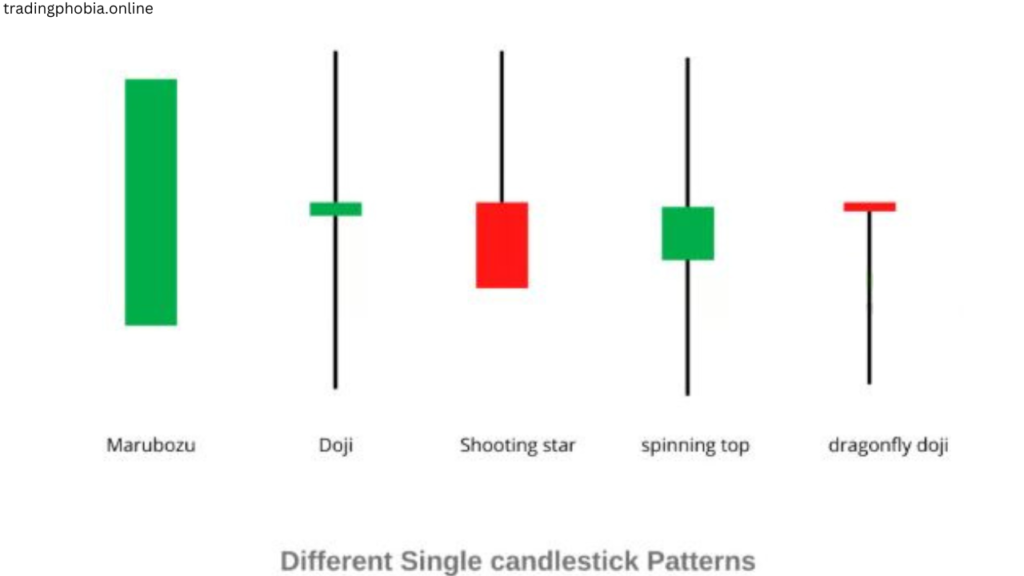
Use Candlestick Patterns
Candlesticks give clues about price direction and momentum.
Important patterns:
Potential reversal is indicated by the Pin Bar.
An Engulfing candle indicates a lot of momentum in one direction.
Doji: Market indecision, possible reversal
Determine the Main Levels of Support and Resistance
Support: The price at which the market typically stops declining and rises again.
Resistance: A price point at which the market typically reverses downward and stops rising.
To indicate these levels on the chart, use horizontal lines.
Identify Patterns
Higher highs and higher lows indicate an upward trend in the price as a whole.
Lower highs and lower lows indicate a downtrend in the price as a whole.
Sideways (range): The price fluctuates between resistance and support.
Look for Price Action Signals
Breakouts: Price moves strongly above resistance or below support.
Reversals: Price changes direction after hitting a key level.
Consolidation: Price moves in a tight range before breaking out.
Use Multiple Timeframes
Check higher timeframes (e.g., 1-hour, 4-hour) for the big picture.
Use lower timeframes (e.g., 5-minute, 15-minute) for detailed entry points.
Watch Market Reaction
Observe how price reacts to news, events, or key levels.
A strong rejection (like a sharp bounce-off support) gives clues about the next move.
Practice and Patience
Predicting price action isn’t 100% accurate—it’s about probabilities.
Practice on demo accounts to learn how patterns and levels work.
Which Candle Stick Pattern Plays Imp Role In Price Action
Certain candlestick patterns are very important in price action because they provide clues about market sentiment and potential price movements. Here are the most impactful ones:
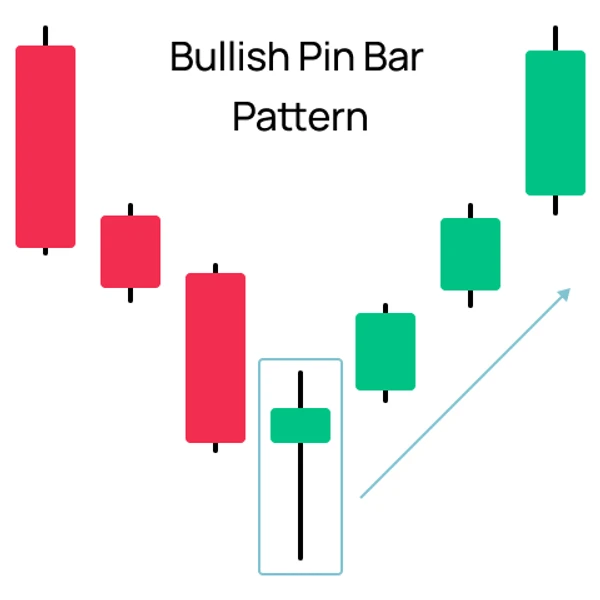
Pin Bar (Rejection Candle)
What it is: A candle with a long wick and a small body near one end.
Why it matters: It strongly rejects a price level, signaling a potential reversal.
Example:
Long upper wick → Bears pushed the price down → Price might fall.
Long lower wick → Bulls pushed the price up → Price might rise.
What Causes a Pin Bar?
When the market strongly rejects a specific price level, a pin bar, also known as a rejection candle, forms. It reflects a battle between buyers and sellers, with one side ultimately losing control. This rejection creates the long wick (or shadow) and the small body of the pin bar, signaling a potential reversal or continuation of the trend.
Price Rejection at Key Levels:
Pin bars often form at support or resistance levels, where many traders place buy or sell orders.
Example:
At support, buyers step in, pushing the price up after it initially falls.
At resistance, sellers dominate, pushing the price down after it initially rises.
What Can You Learn from a Pin Bar?
Long Wick: The wick indicates that the price was rejected after being pushed far in one way.
Small Body: The price’s closing position about its opening position is shown by the small body near one end.
Market Intention: The wick’s direction indicates what the market first attempted to do but was unable to accomplish, such as moving higher or lower.
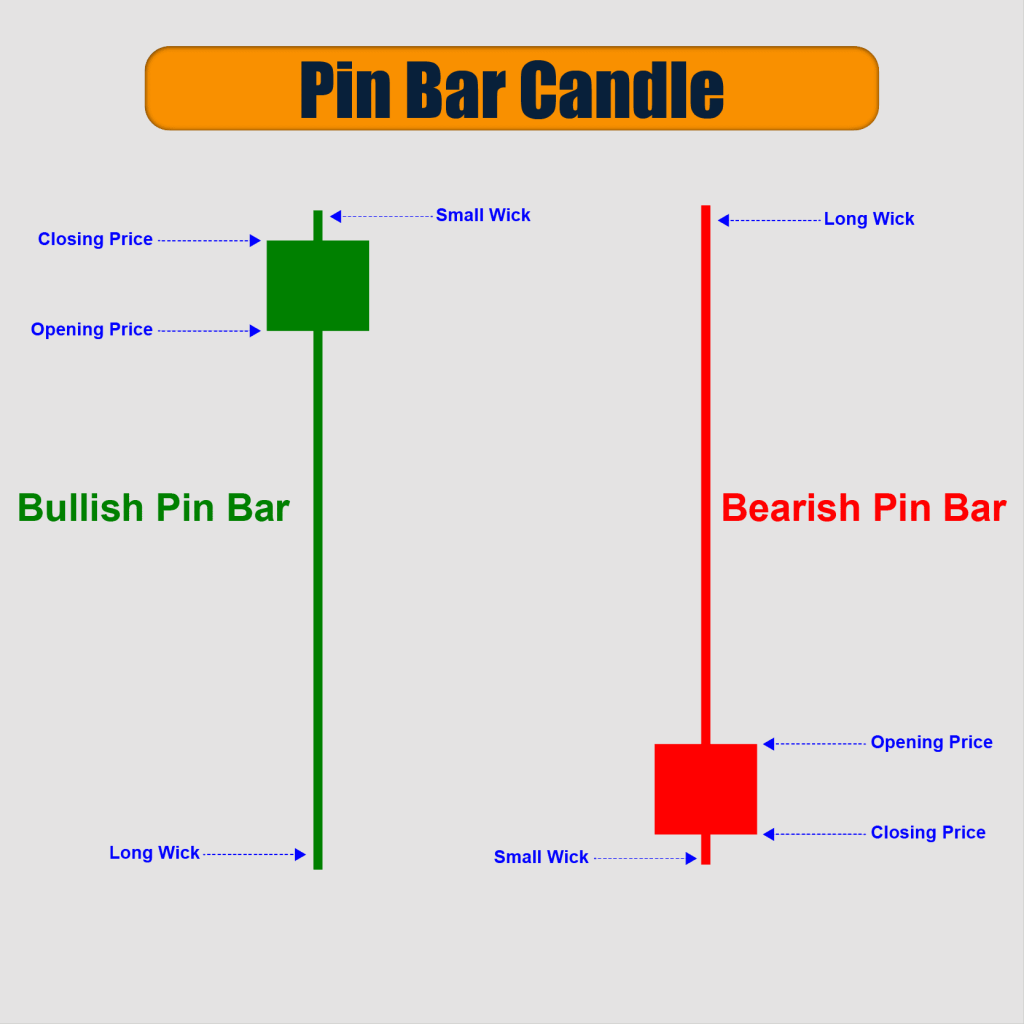
Pin Bar Types
Positive Pin Bar:
long lower wick.
Found at support or in downtrends → Signals a possible upward reversal.
Why: Buyers forcefully intervened when sellers attempted to lower the price.
The bearish pin bar
long wick at the top.
Found at resistance or in uptrends → Signals a possible reversal to the downside.
Why: Sellers took charge as buyers attempted to raise the price.
Crucial Elements to Verify a Robust Pin Bar
Where:
The best times to use pin bars are at Fibonacci retracement levels, trendlines, or significant support/resistance levels.
Context of Trends:
When pin bars follow the general trend, they are more trustworthy.
For instance, a bullish pin bar is more powerful in an uptrend than in a downtrend.
Dimensions:
The wick should be at least two to three times longer than the body.
The body of the candle should be small and close to one end.
Sound level:
Strong participation in rejecting the price is demonstrated by the high volume during the pin bar, which heightens its significance.
Key Chart Patterns for Price Action
The following are some of the most crucial price action trading chart patterns that assist traders in forecasting market movements by analyzing price behavior:
Shoulders and Head (Reversal Pattern)
Creation:
Three peaks: Two lower peaks (shoulders) separated by a higher middle peak (head).
a neckline that joins the shoulder lows.
Signal: A possible reversal of the trend (bearish to bullish for the inverse pattern, or bullish to bearish for the normal pattern).
How to Trade:
In a standard Head and Shoulders, sell when the price drops below the neckline.
Purchase when the price of an inverse head and shoulders breaks above the neckline.
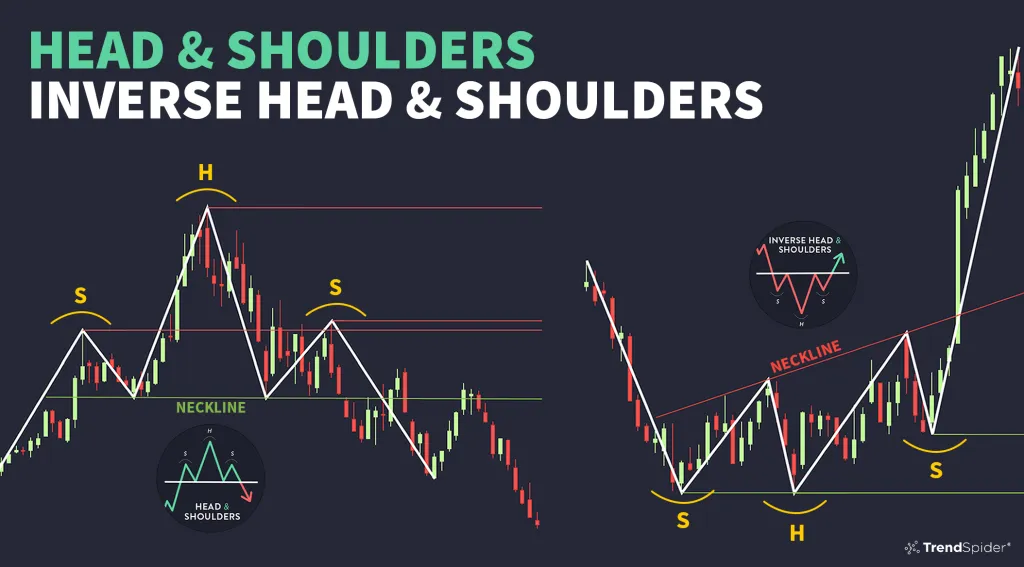
Pic by Trendspider
Both the top and bottom are doubled
Bearish Reversal Double Top:
Resistance is indicated by two peaks that are about the same level.
When the price fails to break higher, it typically reverses downward.
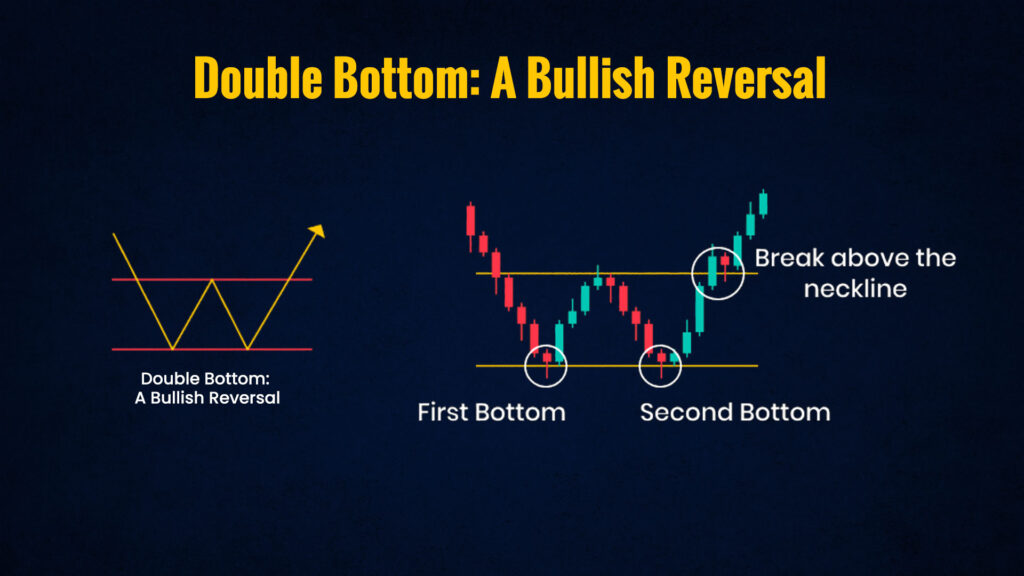
Double Bottom (Reversal to the Bull):
Two troughs indicating support at about the same level.
After failing to break lower, the price typically reverses upward.
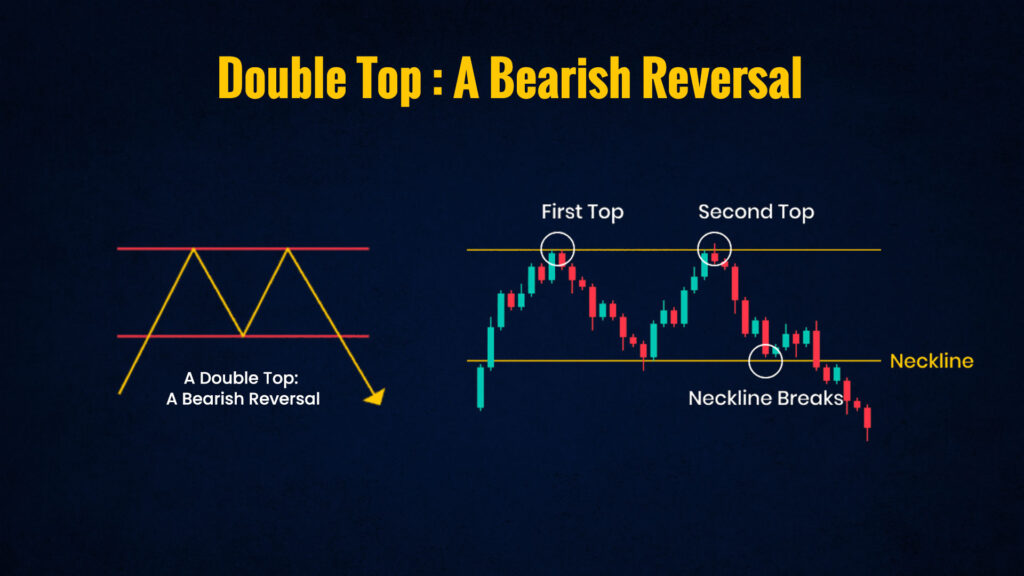
How to Trade:
The “neckline” is the low between two peaks or the high between two troughs. Trade after the price breaks this line.
Pennants (Continuation Patterns) and Flags
Flags:
a rectangular consolidation after a steep price move.
indicates that the trend is probably going to keep going in the same direction.
Pennants:
a brief triangle-shaped consolidation after a steep price move.
signifies the trend’s continuation as well.
How to Trade:
When the price exits the pennant or flag and moves back toward the initial trend, enter.
Triangles
Bullish Ascending Triangle:
resistance that runs horizontally and supports that slopes upward.
shows that buyers are becoming more powerful → A probable upward breakout.
Bearish Descending Triangle:
resistance that slopes downward and horizontal support.
shows that sellers are getting stronger → A downward breakout is probably imminent.
Triangle Symmetry:
trendlines that converge (higher lows and lower highs).
indicates a breakout, but the trend determines the direction.
How to Trade:
Await the triangle’s breakout above or below, then move your trade accordingly.
Wedges
Wedge Rising (Bearish Reversal):
lines that slope upward as the price range gets smaller.
suggests a possible breakout to the downside.
Bullish Reversal (Falling Wedge):
lines that slope downward as the price range gets smaller.
suggests a possible breakout upward.
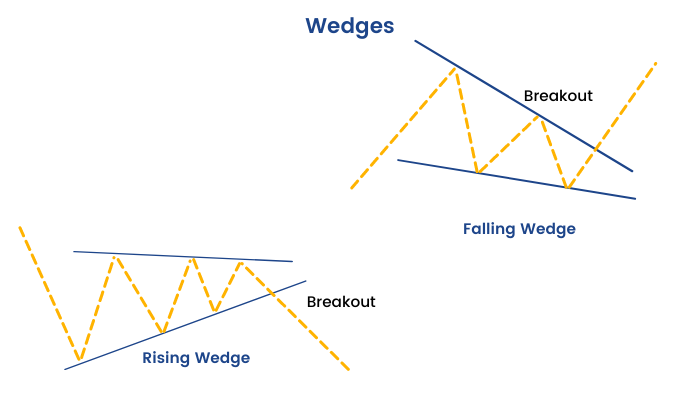
How to Trade:
After the price exits the wedge in the anticipated direction, enter.
Rectangles as a Pattern of Consolidation
Creation:
The price forms a range as it moves between horizontal levels of support and resistance.
Signal
shows hesitancy, but a breakout in either direction frequently results in a powerful move.
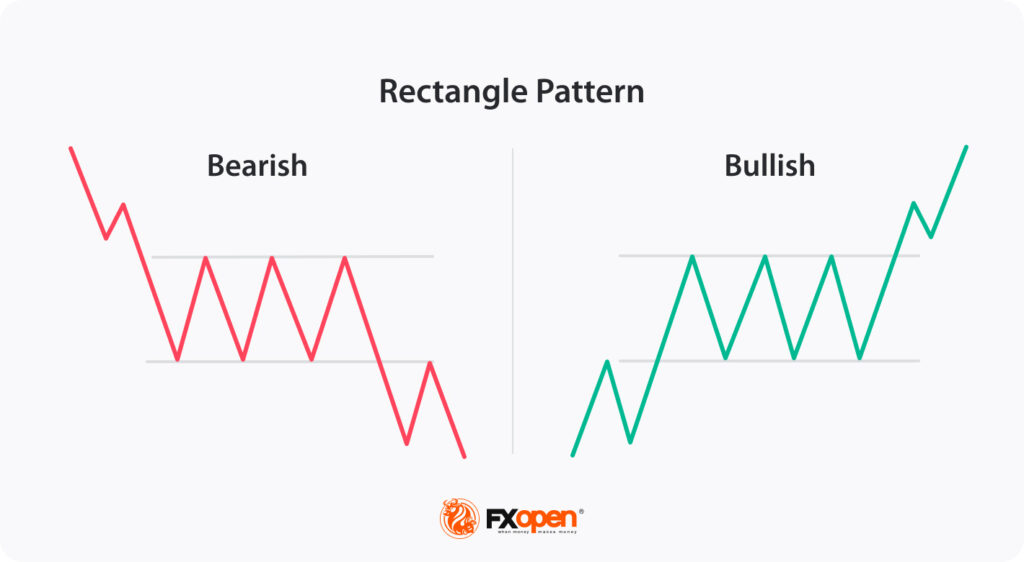
Pic by Fxopen
How to Trade:
Purchase above the resistance breakout or sell below the support breakout.
Cup and Handle (Continuation in Bullish)
Creation:
a tiny consolidation (handle) after a “U”-shaped cup.
shows that the increasing trend is probably here to stay.

Pic by Intrascanner
How to Trade:
When the price rises above the resistance of the handle, enter.
Bottom Rounding (Bullish Reversal)
Creation:
a slow price change that creates a rounded “U” shape.
Signal
shows a gradual shift from a negative to a bullish outlook.
How to Trade:
Purchase once the price surpasses the pattern’s peak.
Channels of Price
Creation:
Between two parallel trendlines (horizontal, descending, or ascending), the price moves steadily.
Signal
Until a breakout happens, the price frequently stays within the channel’s bounds.
How to Trade:
In a range-bound market, buy at the lower boundary and sell at the upper limit.
When the price leaves the channel, trade in the breakout direction.
Formation of Broadening
Creation:
a trend in which price fluctuations broaden over time to resemble a megaphone.
Signal
shows elevated volatility; the breakout’s path may change.
How to Trade:
After confirmation, trade in the breakout direction.
How to Make Effective Use of These Patterns
Add to the Key Levels: Search for these patterns at trendlines, Fibonacci levels, or support/resistance zones.
Await Confirmation: A breakout or rejection is better than trading based just on the pattern.
Control Risk: To guard against fictitious breakouts, use stop-loss orders.
Do you want examples or explicit instructions on how to trade a painstaking pattern?
Let me know the particular chart design you would want thorough instructions and examples for, such as Head and Shoulders, Double Top/Bottom, Flags, or Triangles, and I will break it down with practical steps!