Understanding candlestick patterns is quite interesting. You’ve probably seen those tiny bars, some red, some green, forming various shapes if you’ve ever looked at a trading chart.
These are candlesticks, which provide a wealth of information about the mood of the market. You pouvez identify trends, forecast price changes, and make more informed trading decisions if you can read them. This guide will explain how to understand candlestick patterns, their definitions, and the key patterns you should be aware of.
What is a Candlestick?
A candlestick shows how prices have changed over a given period of time, such as one minute, one hour, or one day. It includes: The main portion of the candle, known as
body : Displays the open and close prices.
wick : The thin lines that extend from the body, or shadow, indicate the high and low prices.
Color : if the price closed higher than it opened, it was green (or white) ; if it closed lower, it was red (or black).
Candlestick Types
You must comprehend the many kinds of candlesticks before we can start discussing patterns:
1. Candlesticks that are bullish (show upward movement)
- Green/White Candle: Customers have the power.
- Hammer: Long lower wick, little body ; indicates reversal.
- A large green candle that completely engulfs the previous red one is known as bullish engulfing, and it is a powerful bullish indication.
2. Candlesticks that are bearish (show downward movement)
- Red/Black Candle: The power is with the sellers.
- Small body, lengthy lower wick (signals reversal in an uptrend) is the hanging man.
- A large red candle engulfing the previous green one is known as bearish engulfing, and it is a strong negative indication.
3. Indecision candlesticks : neither dealers nor buyers are in control
- Doji: The market is uncertain, and the open and closing prices are about equal.
- Spinning Top: weak trend continuation or reversal indication, small body, extended upper and lower wicks.
Key candlestick patterns
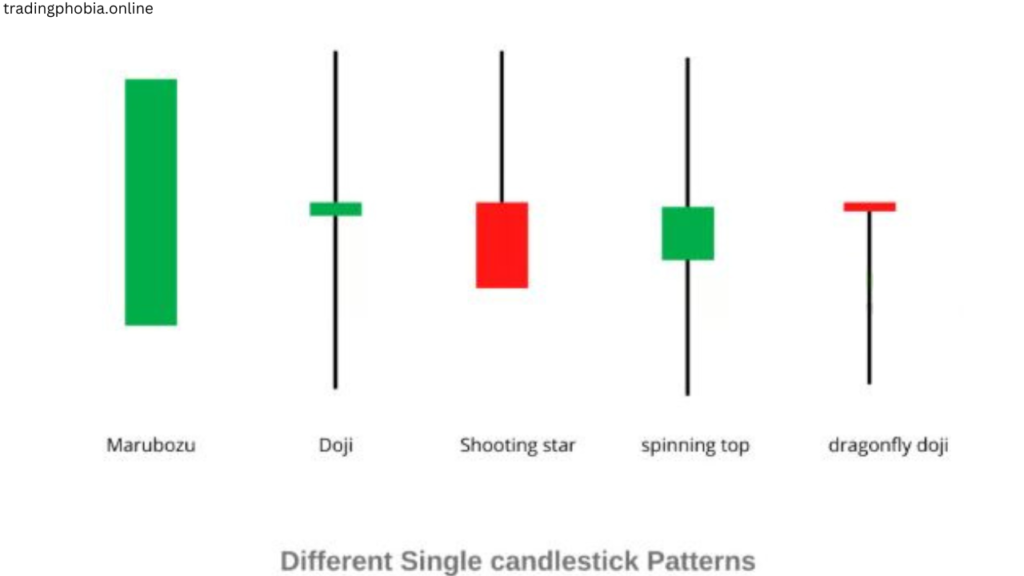
Patterns of a single candlestick
These can show trend continuations or reversals and are made up of a single candlestick.
- Hammer : indicates an upward reversal and appears at the bottom of a downward trend.
- Hanging Man: Indicates a reversal to the downside and appears at the peak of an upward trend.
- Doji: Indicates market hesitancy and may cause reversals.
- Spinning Top: signale un possible changement de tendance et une faible volatilité.
Double candlestick patterns
These frequently indicate trend reversals and are created by combining two candlesticks.
- Bullish engulfing : A bullish reversal occurs when a large green candle fully engulfs the previous red candle.
- Bearish Engulfing: This bearish reversal occurs when a large red candle totally engulfs the previous green candle.
- Two candles with equal highs (bearish) or equal lows (bullish) are known as tweezer tops and bottoms.
Triple candlestick designs
These offer more powerful trend indications and are composed of three candlesticks.
- Morning Star : a red candle, a gap-down little candle, and a bullish reversal large green candle.
- Evening Star : a green candle, a giant red candle (bearish reversal), and a small candle (gap up).
- Three White Soldiers : Three green candles in a row indicate a strong bull market.
- Three Black Crows : A strong bearish signal is shown by three successive red candles.
Understanding How to See Candlestick Patterns Like a Professional :
- Examining a single candlestick pattern reveals little without the trend. The market is trending either way.
- Check volume: a stronger signal results from high volume on a candlestick pattern.
- Verify with indicators: check signals with RSI, MACD, or moving averages.
- Never trade depending on one candle; always consider several candlesticks and other confirmation criteria before deciding what to do.
Ideal Method of Understanding Candlestick Patterns
Traders who wish to grasp market mood and make wise trading selections must learn candlestick patterns. Mastery of them best comes from a structured approach combining theory, experience, and real-time application.
1. Starting with the foundations
Understanding the structure of a candlestick—the open, closing, high, and low prices—is absolutely essential before delving into complicated patterns. Discover the variations between bullish and bearish candles as well as wick representation of volatility. Strong foundations will help one to identify trends much more easily.
2. Discover Fundamental Candlestick Patterns
Though there are hundreds of candlestick patterns, initially pay attention to the most successful ones. Traders routinely use patterns such as Hammer, Doji, Engulfing, and Morning Star. First, commit their forms, meanings, and where they show up in a trend—upstream or downstream.
3. Consult visual aids and flashcards
Using flashcards or pattern charts is among the greatest strategies to review material. Analyse charts with a candlestick cheat sheet that you print. This supports memory retention and recognition.
4. Experiment on Live Charts
Theory by itself is insufficient ; you also must observe trends in real-time. Examine live charts on trading sites such as TradingView or MetaTrader. Try seeing trends as they develop and track how pricing responds later.
5. Backtest and Document Trade
Review past data to observe the various ways that different candlestick patterns performed. Practice trading based on patterns without risking actual money using paper trading—demo accounts.
6. Add to other indicators
Combining indicators like RSI, MACD, and moving averages helps candlestick patterns perform their best. This helps to verify trading signals and increases accuracy.
Consistent application of these techniques will help you acquire a good awareness of candlestick patterns and apply them in trading.
Understand candlestick patterns pros and cons
Pros
- Easy to Understand Compared to complex technical indicators, candlestick patterns are easier to understand since they are visually simple.
helps determine the sentiment of the market. By identifying whether buyers or sellers are in charge, these patterns help traders forecast changes in price.
A flexible tool, candlestick analysis can be used in a number of markets, such as commodities, equities, currency, and cryptocurrencies.
enhances the ability to make decisions By recognizing important trends, traders can improve their entire approach and enter or leave trades at the best times.
Ideal for trading in the short and long term For investors and day traders alike, candlestick patterns provide insightful information.
Cons
- Candlestick patterns are not always reliable since they can occasionally produce erroneous signals that, if used alone, could lead to losses.
Experience is necessary for mastery; beginners may misread or struggle to discern between seemingly identical patterns.
Because it might be risky to rely only on candlestick patterns without volume or trend confirmation, it is advised to utilize this indication in combination with other indicators.
Market manipulation can affect accuracy; in extremely volatile or controlled markets, like cryptocurrencies, patterns can not always act as expected.
There are too many patterns to discover. For inexperienced traders, the sheer volume of candlestick formations can be too much to learn and correctly use.Learn by heart
Understand Candlestick Patterns Conclusion :
A trader who wishes to effectively foretell price movements and analyze market sentiment must possess the ability to master candlestick patterns. These patterns offer traders valuable insights into the behavior of buyers and sellers, thereby enabling them to make well-informed decisions.
To commence, it is crucial to comprehend the fundamental components of a candlestick, such as its body, filaments, and color.
Subsequently, the identification of potential trend reversals or continuations can be facilitated by the acquisition of critical patterns such as Hammer, Doji, Engulfing, and Morning/Evening Stars. Although single candlestick patterns offer rapid signals, double and triple candlestick patterns provide more robust confirmations.
Regrettably, memorizing patterns alone is inadequate. The most effective method of acquiring a comprehensive understanding of candlestick patterns is to engage in hands-on practice with live charts, backtest historical data, and utilise trading indicators for confirmation. TradingView and MetaTrader are platforms that enable traders to identify patterns in real time, thereby enhancing their confidence and recognition.
Ultimately, candlestick patterns should not be employed in isolation; rather, they should be combined with technical indicators, volume data, and trend analysis to form a more precise trading strategy. By consistently researching, practicing, and refining your approach, you can acquire an advantage in the market and make more informed trading decisions.