The double candlestick pattern plays an important role in technical analysis. Candlestick patterns are widely used to predict potential market reversals and continuations. These patterns provide traders with powerful signals, helping them identify trend shifts and changes in market momentum with greater accuracy.
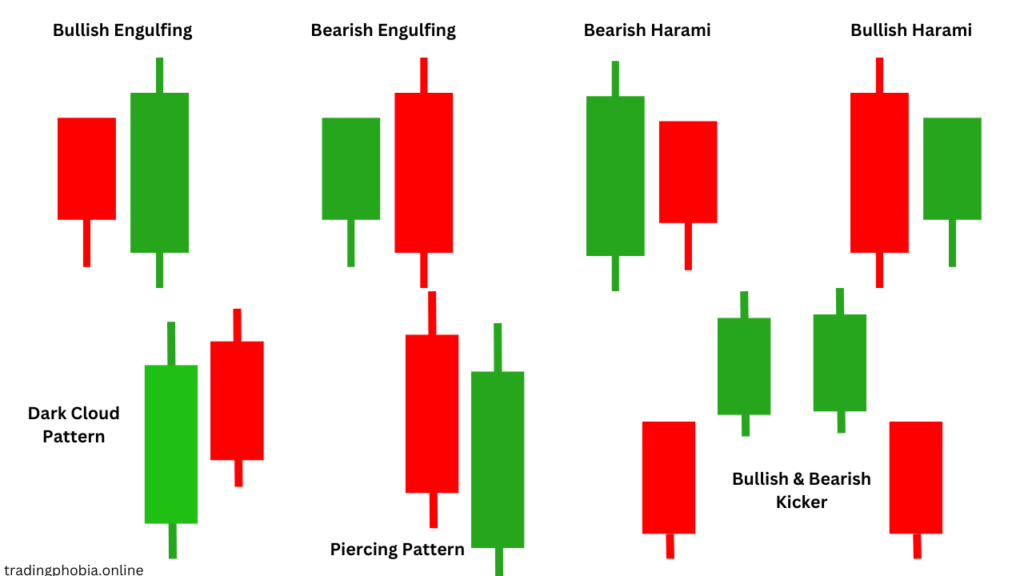
Several important double candlestick patterns are discussed in this article. These patterns include the Bullish and Bearish Kicker, the Bullish and Bearish Engulfing, the Bullish and Bearish Harami, the Piercing Line, the Dark Cloud Cover, the Tweezer Top, and the Tweezer Bottom.
Types of Double Candlestick Patterns:
A double candlestick pattern is a pattern that consists of two candlesticks that are consecutive to one another and indicate the possibility of market reversals or continuations. As a result of their ability to assist traders in making educated judgments based on price action, these patterns are essential to the field of technical analysis. This is a list of some important types:
- Bullish & bearish kicker
- Bullish & Bearish Engulfing
- Bullish & Bearish Harami
- Piercing Line
- Dark cloud cover
- Tweezer top
- Tweezer bottom
1. A bearish & bullish kicker
Bullish Kicker:
- A robust pattern of bullish reversal.
- A big bearish candle is the first one.
- The second candle rises strongly after opening at or above the opening of the first.
- shows significant buying momentum, which is frequently brought on by significant news or events.
Bearish Kicker:
- A powerful pattern of bearish reversal.
- A big bullish candle is the first one.
- The second candle plunges precipitously downward after opening at or below the opening of the first.
- indicates a sharp change in market sentiment and intense selling pressure.
2. bullish & bearish Engulfing
Bullish Engulfing:
- A pattern of bullish reversal.
- A tiny bearish candle is the first one.
- A bigger bullish candle, the second one engulfs the first one entirely. indicates a possible upward trend and high purchasing desire.
Bearish engulfing
- A pattern of bearish reversal.
- A tiny bullish candle is the first one.
- The second candle engulfs the first one and is a larger bearish candle.
- Suggests a possible downward trend and significant selling pressure.
3. Bullish & Bearish Harami
Bullish Harami
- An indication of a possible bullish reversal in movement.
- A huge bearish candle forms the first candle.
- A tiny bullish candle entirely within the first candle’s body makes up the second candle.
- There may be a possible reversal, and the downtrend may be waning.

Bearish Harami
- A reversal pattern that is bearish.
- A huge bullish candle appears on the first candlestick.
- Within the first candle’s body lies a smaller bearish candle, the second candle.
- Points to a possible decline in the market and a slowing of the positive momentum.
4. Piercing Line
- A bullish reversal pattern identified within a downturn.
- The initial candle is an extended bearish candle.
- The second candle opens beneath the previous low but closes above the midway of the first candle.
- Indicates that purchasers are acquiring leverage and may elevate prices.
5. Dark Cloud Cover
- A bearish reversal pattern was identified within an uptrend.
- The initial candle is a robust bullish candle.
- The second candle opens above the prior high but closes beneath the halfway of the first candle.
- Suggests that sellers are acquiring dominance and might potentially depress the market.
6. The Tweezer Top
- A trend of falling prices is seen at market highs.
- Contains two lights that are next to each other and have similar highs.
- The first candle is an optimistic one, and then there is a bearish candle of the same height.
- This means that buyers are losing power, and a change in direction may happen.
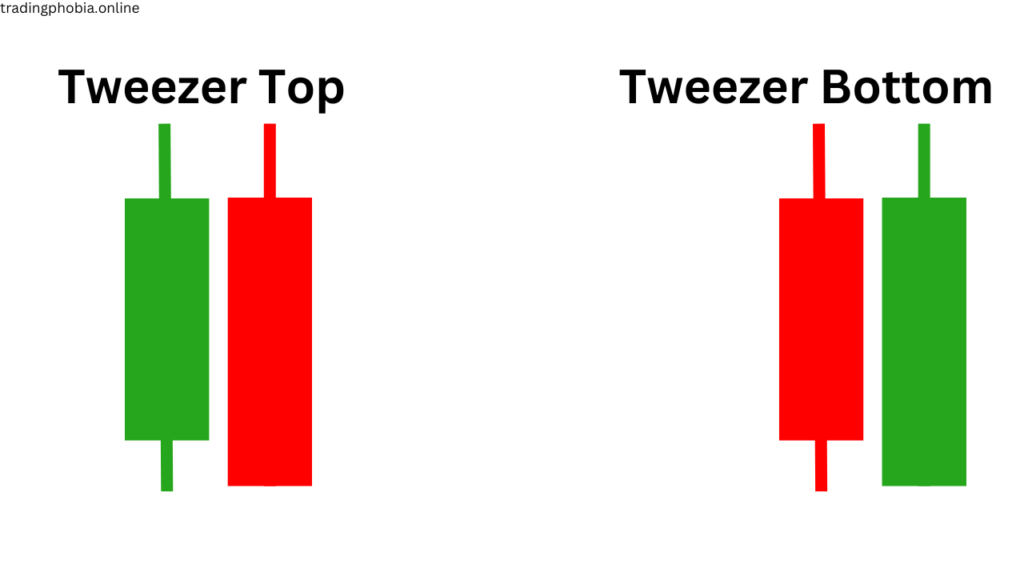
7. The Tweezer Bottom
- A pattern of a bullish turnaround is seen when the market is low.
- Contains two lights that are next to each other and have similar lows.
- The first candle is down, and then there is a positive candle of the same height.
- Strong support for buying and a possible change in the direction.
The most important double candlestick patterns
- Bullish and bearish engulfing are strong reversal signs that show a change in market control.
- The bullish and bearish kicker is one of the strongest reversal patterns. It is often set off by big news or events.
- Dark Cloud Cover and Piercing Line are important patterns that show a change in motion.
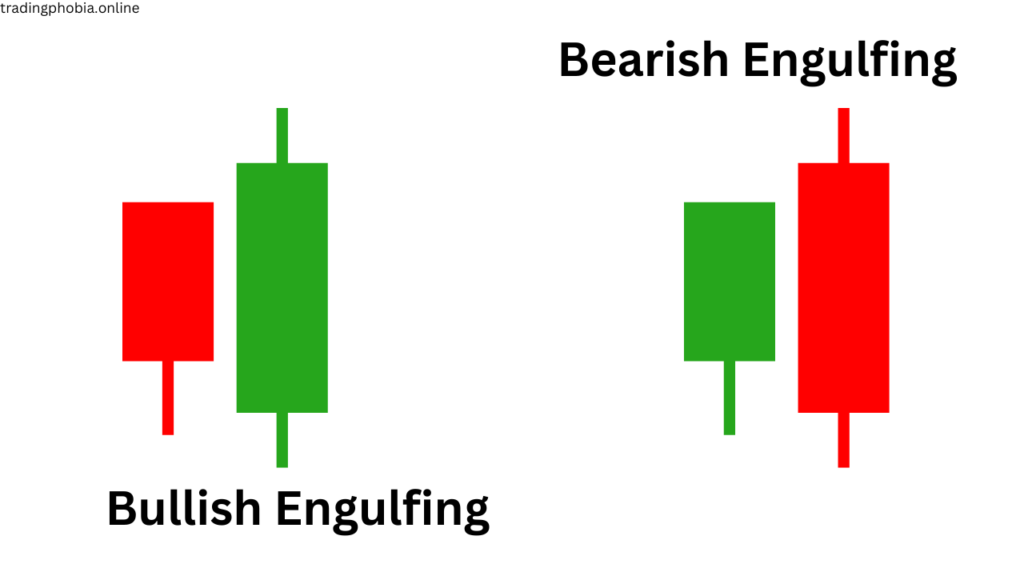
Patterns of Bullish and Bearish Engulfing
In candlestick chart analysis, engulfing patterns are significant reversal indications that traders frequently employ to spot possible trend shifts. These patterns show a change in market attitude when two successive candlesticks are seen, with the second candle fully engulfing the first’s body.
Pattern of Bullish Engulfing
During a downward trend, a bullish engulfing pattern emerges, suggesting a possible upward reversal. It is composed of a little red bearish candle that is completely engulfed by a larger green bullish candle.
This suggests that buyers have seized power and are now dominating sellers. When the pattern appears after a protracted downtrend or close to a significant support level, it is more trustworthy. The reversal signal is strengthened by higher volume on the second candle.
Pattern of Bearish Engulfing
During an uptrend, a bearish engulfing pattern appears, indicating a possible downside reversal. It is composed of a small green bullish candle that is engulfed by a larger red bearish candle.
This suggests rising selling pressure since sellers have overtaken buyers. When the pattern emerges after a strong bullish run or close to a resistance level, it becomes more meaningful.
Trading Strategy:
- Confirmation: Always wait for other evidence, like large trading volume or trendline breaks.
- Stop-Loss: Put your stop-loss above the engulfing candle in bearish setups and below it in bullish ones.
- Entry Points: Ideally, traders use moving averages or RSI as supporting indicators when they enter after the second candle closes.
Although engulfing patterns are useful tools, traders should use them in conjunction with other technical indicators to make well-informed decisions.
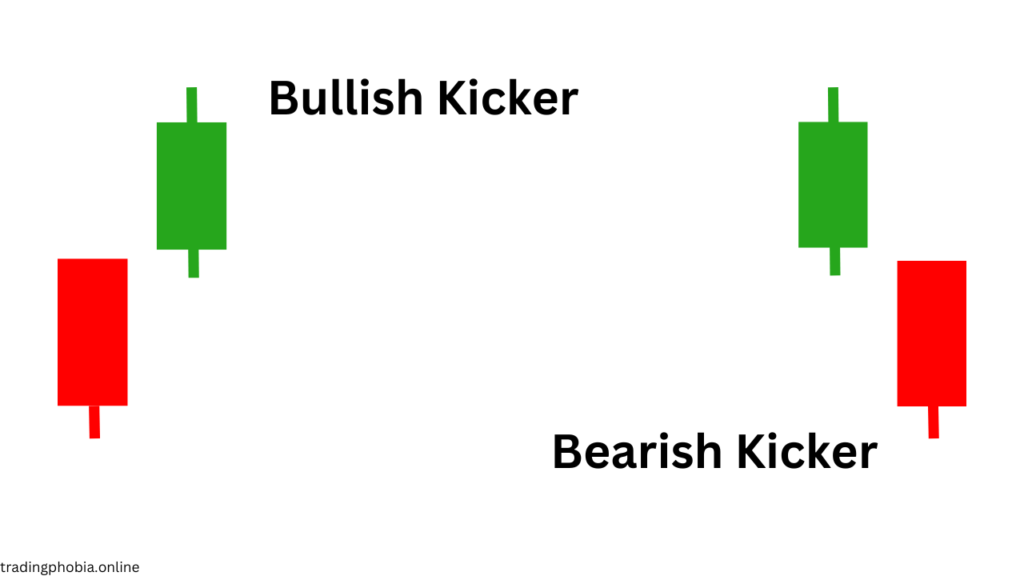
Bullish & Bearish Kicker Pattern: A Strong Reversal Signal
The Kicker pattern is one of the most powerful double candlestick patterns in technical analysis. It indicates a sudden and sharp reversal in market direction, often caused by unexpected news, earnings reports, or significant economic events. The pattern suggests a significant shift in momentum, making it highly reliable for traders.
Bullish Kicker Pattern
Formation and Characteristics:
- The first candlestick is a massive bearish candle (signifying a downturn).
- The second candlestick opens at or above the previous open and rises swiftly.
- There is no overlap between the two candles; therefore, the second candle “kicks” away from the first.
- Often accompanied by heavy trade volume, which reinforces the reversal.
What This Means:
- A quick shift in emotions from bearish to bullish.
- Typically sparked by extremely optimistic news or economic data.
- This suggests that bulls have taken complete control, resulting in a robust upswing.
Trading strategy:
- Confirm with Volume—Increased trading volume strengthens the signal.
- Look for Key Support Levels—If the pattern appears near a support zone, the reversal is more likely.
- Long Positions—If the second candle closes strongly, traders can enter long positions.
- To manage risk, set a stop loss below the first candle’s low.
Bearish Kicker Pattern
Formation and Characteristics:
- The first candlestick is a large bullish one, signaling an uptrend.
- The second candlestick opens at or below the prior one and descends swiftly.
- There is no overlap between the two candles, indicating a dramatic emotional shift.
- Frequently accompanied by significant selling volume, indicating bearish pressure.
What This Means:
- A significant shift in sentiment, from bullish to bearish.
- Typically triggered by negative news, earnings announcements, or significant market occurrences.
- This indicates that bears have taken control, resulting in a significant downturn.
Trading strategy:
- Confirm with Volume: Increased selling pressure amplifies the negative indication.
- Look for Resistance Zones: If the pattern appears near a resistance level, the reversal is more likely.
- Enter Short Positions —Once the second candle confirms downward movement, traders can go short.
- To manage risk, set a stop loss above the first candle’s high.
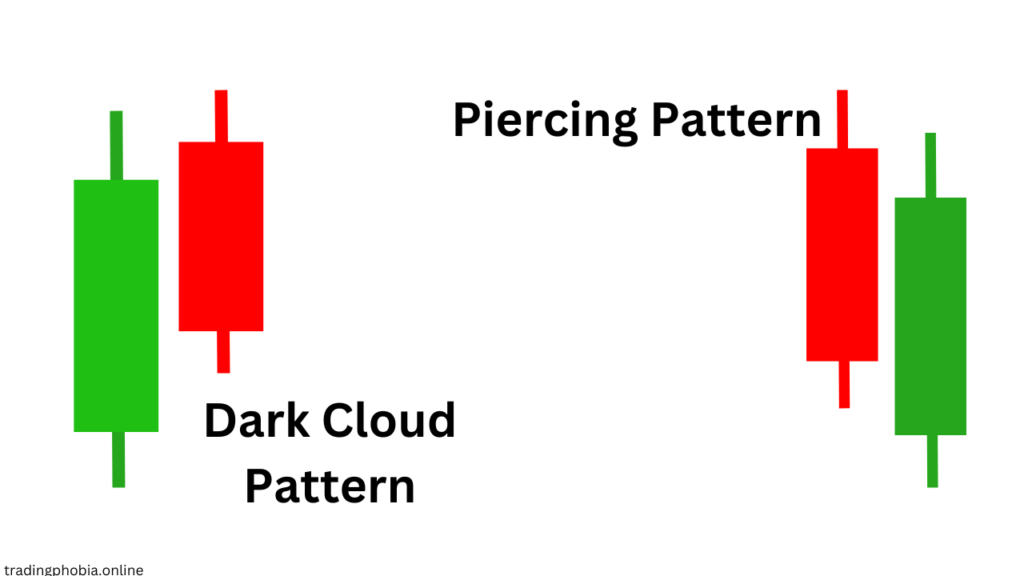
Dark Cloud Cover and Piercing Line
Dark cloud cover (a bearish reversal pattern)
- Occurs in an uptrend, indicating a possible negative reversal.
- The first candle shows a strong bullish trend, indicating buyer domination.
- The second candle opens above the previous candle’s high but closes below the midway, indicating seller control.
- Bullish momentum is waning, while bearish pressure is building.
- A stronger signal when combined with a large volume and validation from indicators such as RSI or MACD.
Trading strategy:
- Look for formation at key resistance levels to ensure reliability.
- Place a short trade after receiving confirmation from the next bearish candle.
- To manage risk, set a stop-loss above the first candle’s high.
Piercing Line (Bullish Reversal Pattern).
- Occurs amid a downtrend, indicating a possible bullish reversal.
- The first candle is a strong bearish candle that indicates seller strength.
- The second candle begins below the first candle’s low but closes above its midway, indicating buyer dominance.
- This suggests a shift from a negative to a positive mood.
Trading strategy:
- Look for formations in support zones for confirmation.
- Place a long trade following a bullish confirmation candle.
- To reduce risk, set a stop loss below the low of the first candle.
Double Candlestick Pattern Pros & Cons
Pros
- Reliable Signals: Compared to single candlestick patterns, double candlestick patterns offer more distinct reversal and continuation signals.
Simple to Identify: Traders may easily identify them thanks to recognizable patterns like engulfing, kicker, and piercing line.
Effective in both short-term and long-term trading methods, it operates over a variety of timeframes.
Combines Well with Indicators: Technical indicators such as the RSI and MACD, volume, and support/resistance levels can all be used to validate this.
Strong Reversal Confirmation: Signs of a significant change in momentum include bearish kicker and bullish engulfing patterns.
Cons
- Reliable Signals: Compared to single candlestick patterns, double candlestick patterns offer more distinct reversal and continuation signals.
Simple to Identify: Traders may easily identify them thanks to recognizable patterns like engulfing, kicker, and piercing line.
Effective in both short-term and long-term trading methods, it operates over a variety of timeframes.
Combines Well with Indicators: Technical indicators such as the RSI and MACD, volume, and support/resistance levels can all be used to validate this.
Strong Reversal Confirmation: Signs of a significant change in momentum include bearish kicker and bullish engulfing patterns.
Double Candlestick Pattern Conclusion:
Double candlestick patterns are effective technical analysis tools, giving traders with consistent signs for future trend reversals and continuations. Patterns such as Bullish and Bearish Engulfing, Kicker, Piercing Line, Dark Cloud Cover, Harami, and Tweezer forms can provide vital insights into market sentiment movements. These patterns are useful throughout a variety of timescales and can be used in stock trading, forex, and cryptocurrency markets.
However, while double candlestick patterns are effective visual clues, they should not be used alone. To improve accuracy, traders should confirm these patterns using volume analysis, support and resistance levels, moving averages, and momentum indicators such as RSI or MACD. Furthermore, market conditions, news events, and overall trend direction are important factors in confirming the signals created by these patterns.
Double candlestick patterns, while reliable, are not flawless. False signals may occur, particularly in choppy or low-volume markets. As a result, proper risk management measures, such as stop-loss orders and position sizing, are required to reduce losses.
By studying double candlestick patterns and using them into a well-rounded trading strategy, traders may dramatically strengthen their ability to spot high-probability trading opportunities and improve overall market performance.