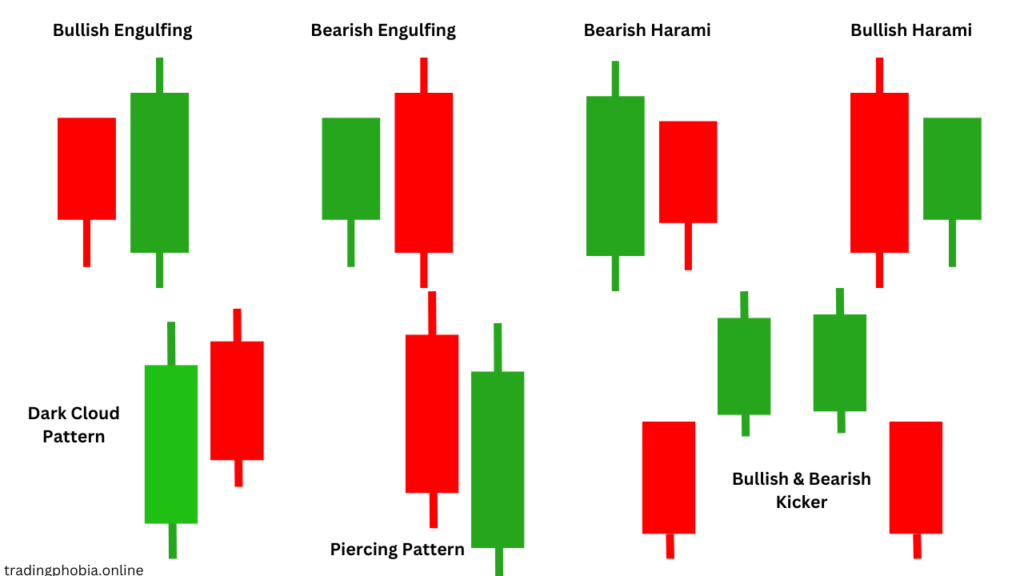
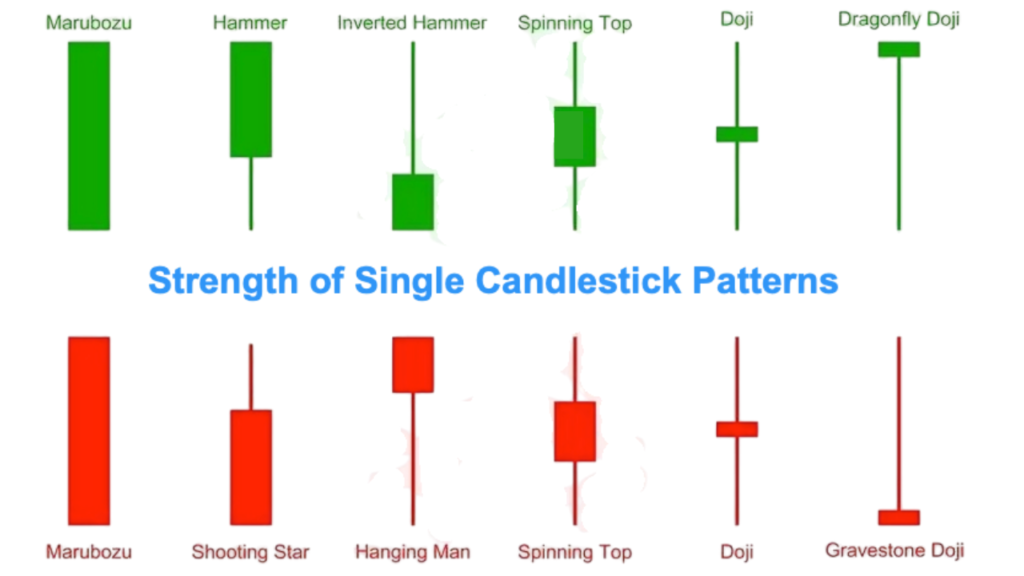
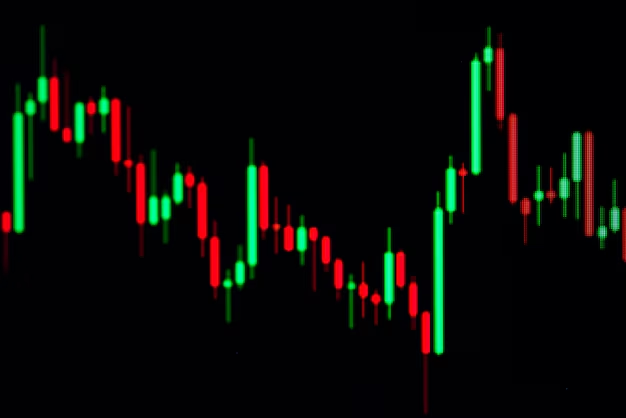
Understanding candlestick patterns is quite interesting. You’ve probably seen those tiny bars, some red, some green, forming various shapes if you’ve ever looked at a trading chart. These are candlesticks, which provide a wealth of information about the mood of the market. You pouvez identify trends, forecast price changes, and make more informed trading decisions if you can read them. This guide will explain how to understand candlestick patterns, their definitions, and the key patterns you should be aware of. What is a Candlestick? A candlestick shows how prices have changed over a given period of time, such as one minute, one hour, or one day. It includes: The main portion of the candle, known as body : Displays the open and close prices. wick : The thin lines that extend from the body, or shadow, indicate the high and low prices. Color : if the price closed higher than it opened, it was green (or white) ; if it closed lower, it was red (or black). Candlestick Types You must comprehend the many kinds of candlesticks before we can start discussing patterns: 1. Candlesticks that are