Trading charts are the foundation of technical analysis, allowing traders to predict price changes and make informed decisions. Whether you are a novice or a seasoned trader, learning how to interpret trading charts is critical for improving your trading approach.
In this article, we’ll go over everything you need to know about reading trading charts, including chart types, indicators, patterns, and how to apply them effectively in your trading journey.
The Crucial Elements of Reading Trading Charts
- Understanding the Fundamentals of Trading Charts
- Types of Trading Charts
- Key Candlestick Patterns to Monitor
- Understanding the Technical Indicators
- Identifying Support and Resistance Levels.
- Trading Chart Patterns
- Reading Market Sentiment Using Trading Charts
Understanding the Fundamentals of a Trading Chart
Price movements over a given time period are graphically represented by a trading chart. It is made up of various essential parts:
a) The Time and Price Axes
- On the right side of the chart, the price of the asset is shown via the price axis (Y-axis).
- The Time Axis (X-axis) displays the chronology and shows how prices have changed over time.
b) Time frames for Charts
- One-, five-, and fifteen-minute intraday charts (for short-term traders).
- Investors and swing traders use daily and weekly charts.
- Monthly Charts: Used by long-term investors to examine more general patterns.
Types of Trading Charts
Trading charts come in a variety of forms, each with unique benefits.
a) Line Chart
- linking closing prices over time to create the most basic type of chart.
- ideal for spotting long-term patterns.
- Not the best for in-depth price action research.
b) A bar chart
- displays each period’s open, high, low, and close (OHLC) prices.
- aids in the analysis of volatility by traders.
- less eye-catching than charts with candlesticks.
c) The most widely used candlestick chart
- The open, high, low, and close prices are all represented by each candlestick.
- provides a graphic depiction of market emotion.
- frequently employed to recognize patterns such as Engulfing, Hammer, and Doji.
Key Candlestick Patterns to Monitor
a) Bullish Patterns.
- Hammer: Indicates a potential reversal of a downtrend.
- Bullish Engulfing: This indicates significant buying pressure.
- Morning Star: Signals a positive reversal.

c) Bearish Patterns.
- Shooting Star: Signifies a bearish reversal.
- Bearish Engulfing: Significant selling pressure.
- Evening Star indicates a bearish trend.
Understanding the Technical Indicators
Technical indicators assist traders in confirming patterns and forecasting price moves. Some relevant markers are:
a) Moving averages (MA).
- Simple Moving Average (SMA): Smoothes price data over time.
- Exponential Moving Average (EMA): Gives greater weight to recent prices.
b) The Relative Strength Index (RSI)
- Measures momentum on a scale of 0 to 100.
- RSI readings above 70 indicate an overbought market, while readings below 30 indicate an oversold market.
c) Moving average convergence divergence (MACD).
- depicts the relationship between two moving averages.
- A MACD crossover indicates potential buying or selling opportunities.
d) Bollinger Bands.
- It consists of three bands: upper, middle, and lower.
- A price that touches the higher band may indicate that the market is overbought, whilst the lower band indicates that the market is oversold.
e) Volume indicator.
- Assesses the strength of a trend.
- Higher volume suggests increased buying or selling pressure.
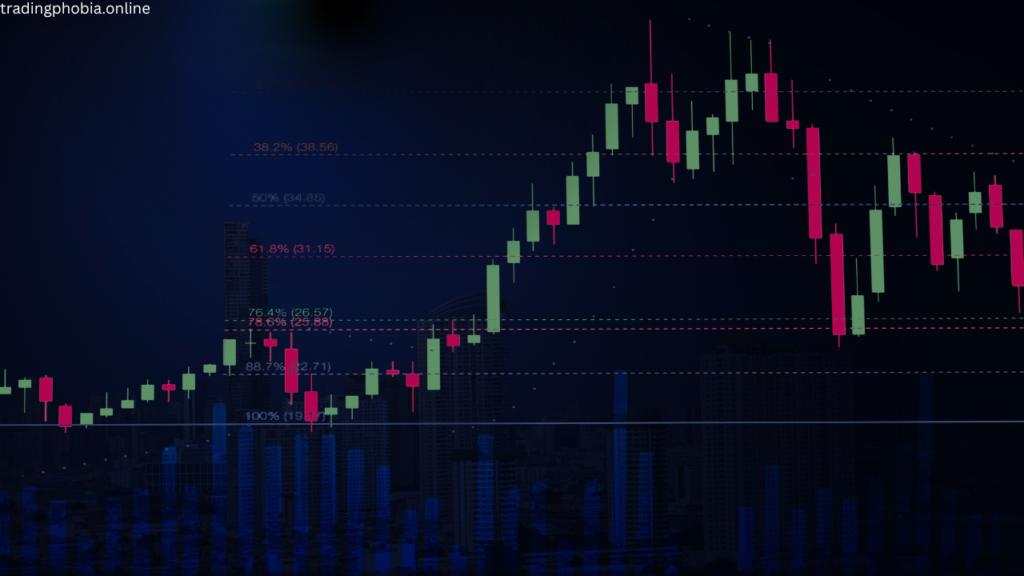
Identifying Support and Resistance Levels.
- Support Level: A price level at which demand is sufficiently robust to avert further decline.
- Resistance Level: A price level at which the selling pressure is sufficiently robust to impede further price appreciation.
- Breakout: A new trend is frequently indicated when the price surpasses support or resistance.
Trading Chart Patterns
a) Patterns of Continuation
Traders utilize chart patterns to predict future price fluctuations.
- Ascending Triangle: A bullish pattern that suggests an upward trend.
- Descending Triangle: A bearish pattern that implies a downward trend.
- Flags & Pennants: Consolidation in the short term prior to the resumption of the trend.
b) Patterns of Reversal
- Head and Shoulders: Indicates a trend reversal.
- Indicates market reversal points: double top and double bottom.
- Cup and Handle: Indicates a bullish continuation.
Reading Market Sentiment Using Trading Charts
- Bullish Attitude: Increased highs and lower lows.
- Bearish sentiment is characterized by lower highs and lower lows.
- Neutral Market: Movement in a sideways direction without discernible trends
Reading Trading Chart
Pros
- Assists traders in making judgments based on evidence.
It offers insights into the behavior of prices and trends in the market.
Provides assistance in risk management by utilizing tactics such as stop-loss and take-profit.
It is applicable to a variety of markets, including stocks, forex, cryptocurrency, and others.
Cons
- To achieve mastery, patience and practice are required.
A loss may occur as a result of false signals.
It can be dangerous to rely excessively on charts without first conducting fundamental research.
Reading Trading Chart Conclusion
For traders who wish to make data-driven judgments, the ability to read trading charts is crucial. You may increase your trading accuracy and lower your risks by being knowledgeable about various chart types, candlestick patterns, indicators, and trend analysis.
To increase your chances of success, technical analysis must be used in conjunction with other elements such as risk management and fundamental analysis. You will get the skill to successfully analyze trading charts and execute lucrative trades with constant practice and experience.
To confidently improve your trading approach, begin examining trading charts right now!