Recognizing trend reversals early on often means the difference between significant gains and excruciating losses in the fast-paced world of trading.
The reversal chart pattern is one of the best tools traders have for this. However, what is it actually, and how can you use it effectively? Let’s explore reversal chart patterns in more detail and see how these visual cues might change the way you trade.
A Reversal Chart Pattern: What Is It?
A price chart formation that suggests a possible shift in the current trend is known as a reversal chart pattern. It suggests that the present trend, whether bullish or negative, is waning and may turn around.
For instance, a reversal pattern may indicate that an asset is going to begin declining (downtrend) if it has been rising steadily (uptrend), and vice versa.
A crucial component of technical analysis, these patterns assist traders in basing their conclusions on past price data rather than on hunches or the news.
Why Do We Need Reversal Patterns?
A straightforward response? They alert you to the situation.
- Are you trying to figure out when to get out of a transaction before a trend changes?
- Are you attempting to ride a new trend all the way up (or down) by catching it early?
- Want to increase revenues while lowering risk?
For all of these things, reversal patterns are helpful. For traders, they are similar to traffic signals; if you can read them, you can move more confidently around the market.
Important Features of Reversal Patterns
Prior to discussing the various kinds, let’s discuss what to look for in a reversal pattern:
- A previous trend: Without a trend, a reversal is impossible. Seek out a distinct upward or downward trend.
- Confirmation of volume: During a reversal, volume frequently spikes, indicating a change in momentum.
- Direction of breakout: The price typically breaks out in the opposite direction of the existing trend when the pattern is finished.
- Duration: In intraday charts, reversal patterns may develop over minutes, while in long-term charts, they may develop over months.
The Most Important Reversal Chart Patterns for Traders to Be Aware Of
Let us examine the most prevalent and dependable reversal chart patterns:
- Head and Shoulders
Type: Bearish Reversal
Appearance in: Uptrends
Three peaks comprise the head and shoulders pattern:
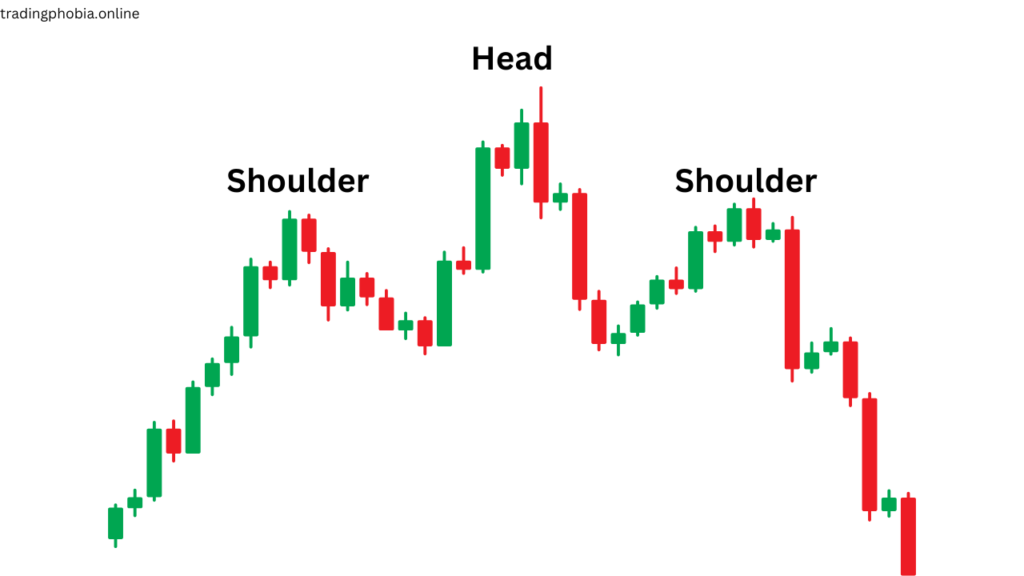
The tallest point is the middle peak, which is referred to as the “head.” The two outer peaks, which are referred to as the “shoulders,” are approximately equal in height and placed lower. The lows are connected by a neckline.
A reversal from an uptrend to a downtrend is indicated when the price breaks below the neckline.
The inverse head and shoulders pattern functions similarly, but in the opposite direction, suggesting a bullish reversal from a downtrend.
- Double Top and Double Bottom
Type: Double Top = Bearish | Double Bottom = Bullish
These patterns are straightforward yet potent.
Double Top:
A dip in between two summits at the same level. A downtrend typically ensues when the price falls below the support level between the peaks.
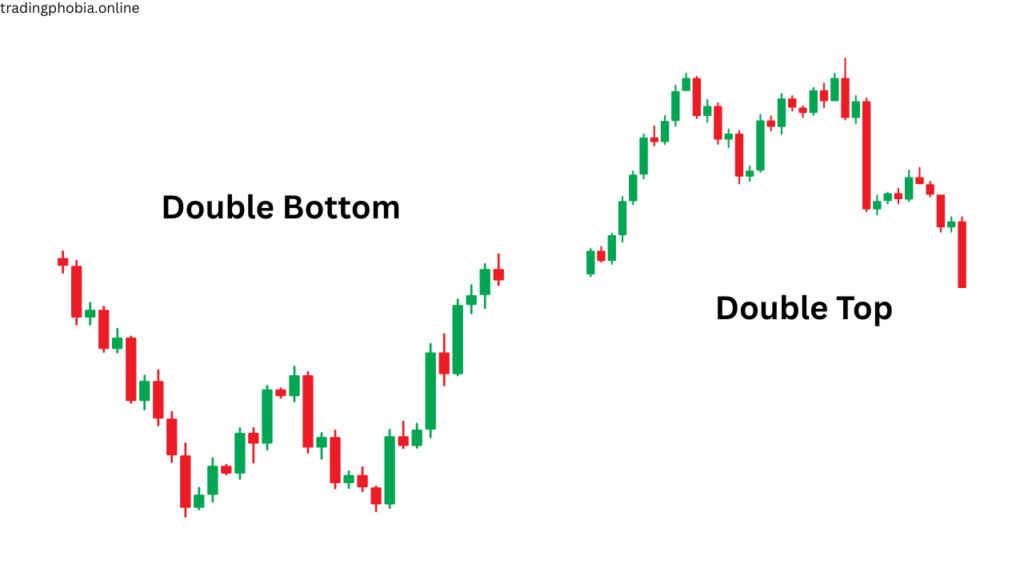
Double Bottom:
A peak that is situated between two valleys that are at the same elevation. A bullish reversal is confirmed by a breach above the resistance.
Pro Tip: For more robust substantiation, monitor the breakout’s rising volume.
- Triple Top and Triple Bottom
It is similar to a double top/bottom, but with an additional peak or valley.
This breakout is rendered even more significant by the fact that these patterns exhibit increased resistance or support.
Although triple patterns are slightly less prevalent, they can provide highly dependable signals when traded with patience and volume confirmation.
- Rising Wedge and Falling Wedge
Rising Wedge: Indicates a pessimistic reversal and is observed during an uptrend. The price increases, but it does so within a decreasing range.
Falling Wedge: Indicates a favorable reversal and is observed during a downtrend. As the spectrum narrows, the price decreases.
The wedge patterns frequently exhibit abrupt breakouts, which provide advantageous entry points.
- Rounding Top and Bottom Rounding Top:
The price rises gradually, forms a curve, and then begins to decline, indicating a bearish reversal.
Rounding Bottom: The price experiences a downward trend, a flattening out, and a gradual ascent, indicating a bullish reversal.
These patterns require an extended period of time to develop, but they provide reliable indicators of long-term trend changes.
How to Trade Reversal Patterns Like a Pro
Identifying the pattern is only one aspect of the challenge. Trade them intelligently by following these steps:
Step 1: Determine the Pattern in a Well-Defined Trend
Refrain from exerting pressure. Ensure that the pattern emerges subsequent to a discernible uptrend or downtrend.
Step 2: Await Confirmation
Do not engage in a trade prior to the breakout. It is crucial to have a confirmed breach, which is when the price closes above or below the pattern.
Step 3: Validation through Volume
The signal is fortified by an increase in volume during emergence. Is the volume low? Exercise caution; it may prove to be an error.
Step 4:
Establish the entry, stop loss, and target: In the aftermath of the escape
Stop loss: Just outside the pattern (above resistance or below support)
Target: Determine the pattern’s height and project it from the breakout point.
Step 5: 5Manage the Trade in
Refrain from becoming excessively demanding. When the trade is in your favor, adjust your stop-loss to break even. If necessary, take partial profits.
Common Errors to Avoid
- Entering the market prematurely: Patience is something that is rewarded. It is imperative to await confirmation.
- Ignoring volume: It is your most reliable ally in the validation of breakouts.
- Failure to implement a stop loss: A single error can result in the complete loss of your profits.
- Forcing patterns: If it does not appear to be in order, it is likely not. Avoid the exchange of delusions.
Reversal Chart Pattern Pros & Cons
Pros
- Early Trend Detection
Reversal patterns assist traders identify probable trend changes before they occur, allowing for early entry into new market directions.
Clear visual cues.
These patterns produce plainly identifiable forms, giving them an accessible tool for technical analysis.
Applicable throughout timeframes.
Whether you are a day trader, swing trader, or long-term investor, reversal patterns can be used to any timeframe.
Works well with other indicators.
Reversal patterns can be paired with RSI, MACD, moving averages, and volume to improve accuracy.
Improves risk management.
With well-defined breakout points, stop-loss and target levels can be more precise, making trade management easier.
Cons
- Requires confirmation
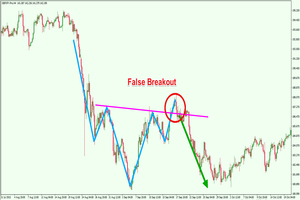
Reversal patterns are not usually consistent on their own. False signals, which lack confirmation (such as volume or candle patterns), can result in losses.
Subjectivity in Pattern Recognition.
What one trader sees as a Head and Shoulders pattern may not be the same for another. This subjectivity can produce inconsistent results.
Nature is lagging.
Some reversal patterns take time to build, so you may miss the beginning of the trend turn.
Not 100% accurate.
Reversal patterns, like any other technical analysis tool, are not 100% reliable. They may fail, particularly in extremely volatile or news-driven markets.
Can be misleading in sideways markets.
During consolidation phases or low-volume sessions, patterns may emerge without any underlying market conviction, resulting in misleading breakouts.
Conclusion on reversal chart pattern
Reversal chart patterns are significant visual signals that convey a deeper tale about price movement, market psychology, and possible turning points—not just forms on a chart.
Understanding these trends and their formation helps traders to develop a strategic advantage in predicting when a new trend is likely to start and when one is likely to fade.
Whether your analysis is of a Head and Shoulders, Double Top, or Falling Wedge, every pattern provides a different window of view on market activity. Real key, though, is risk management, discipline, and validation.
A pattern is a signal; it is never a promise by itself. Add it to additional indicators such volume, support/resistance levels, and appropriate stop-loss techniques to maximize accuracy and more assured trading judgments.
Learning reversal patterns requires time, experience, and patience, much as any ability in the trading environment. Start modest, backtest your plans, and improve your entry and exits. These habits will become second nature over time, enabling you to see possible chances before the public does.
Reverse chart patterns ultimately reflect understanding of the market rather than only market prediction. Understanding the market also helps you trade consistently, with clarity and conviction.