Single candlestick patterns are effective trading tools that offer important information on trend continuations, reversals, and market mood. Because of its simplicity and efficacy, single candlestick patterns are especially significant among these. These patterns can indicate future price changes and help traders make better judgments because they develop in a single trading session.
The most important single candlestick patterns will be examined in this post, along with an explanation of their composition, significance, and influence on market developments. Every pattern reveals significant changes in momentum and tells a different tale of the conflict between buyers and sellers.
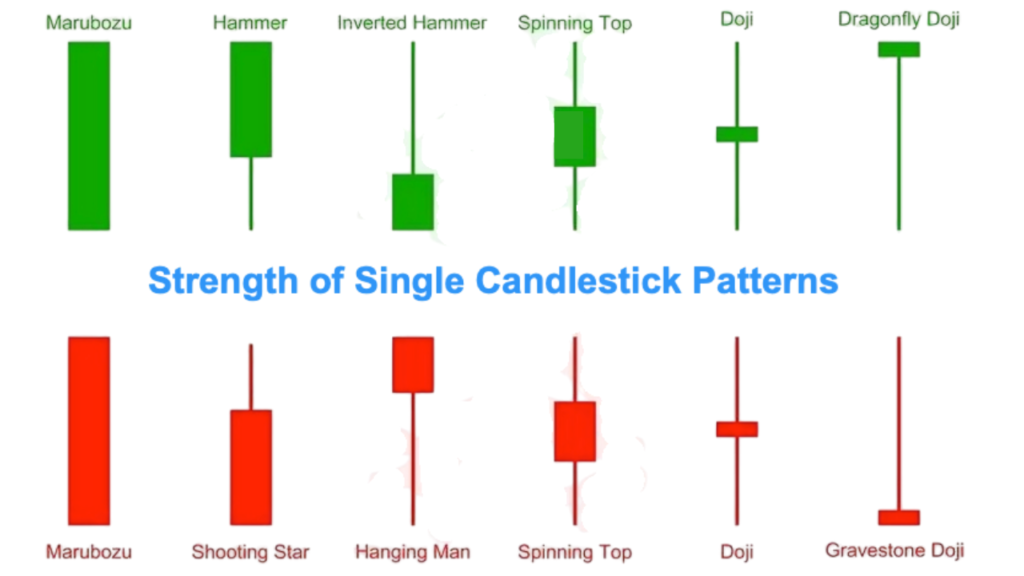
The Doji, Hammer, Shooting Star, Spinning Top, and Marubozu are common single candlestick patterns. A hammer suggests a possible bullish reversal, whilst a doji shows market hesitation. Conversely, a spinning top indicates market ambiguity, while a shooting star indicates bearish reversals. The marubozu symbolizes strong directional velocity because of its large body and lack of wicks.
By comprehending these trends, traders may create profitable trading plans and make more accurate price predictions. Traders can enhance their decision-making process, lower risks, and increase profits by identifying these signals. Understanding single candlestick patterns is crucial for confidently navigating financial markets, regardless of trading experience level.
What Are Single Candlestick Patterns?
Single candlestick patterns are made up of individual candles on a price chart that show important information about how the market is feeling and how prices might move in the future. Even though these patterns look simple, they can show when a trend is changing, continuing, or the market isn’t sure what to do. This makes them useful tools for traders.
The body, the wick (shadow), and the position in the overall trend are what make up each individual candlestick design. As an example, a “Doji” shows that buyers and sellers are evenly matched, which means that no decision has been made. On the other hand, a “Hammer” indicates that there may be a bullish turnaround after a downtrend. In the same way, a “Shooting Star” shows a possible turn around in the bearish trend, and a “Marubozu” shows great momentum in a certain direction.
Traders use these patterns along with technical indicators and information about the market to confirm signs and make smart trading decisions. Traders can predict price changes, handle risk better, and come up with profitable trading strategies in a variety of market conditions by learning to recognize single candlestick patterns.
Here is a full list of the most important single candlestick patterns:
1. A doji
It has a small body, and the open and close prices are almost the same.
Significance: It means the market isn’t sure what to do.
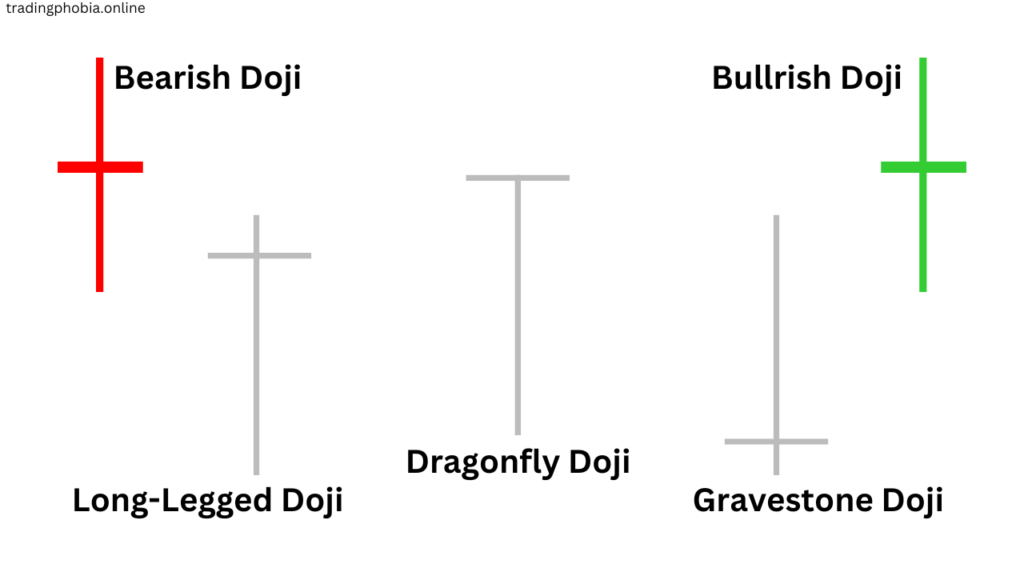
Various forms:
- Neutral doji. Open and close are just about the same.
- The long-legged doji is very volatile and has a small body.
- Gravestone Doji: Pattern of a bearish turn around.
- Dragonfly Doji: Pattern of a bullish turn around.
Tip for traders: A doji in an uptrend or downtrend can mean a possible turn around, especially if it is followed by a confirmed candle.
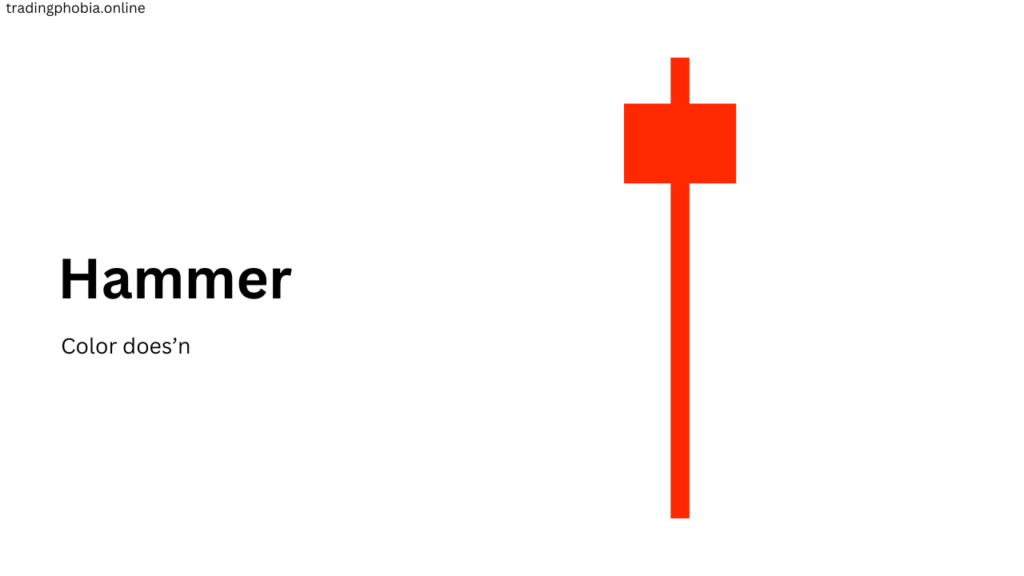
2. Hammer
Look: Little body with a long lower wick—at least twice the body’s size.
importance: After a downturn, a bullish reversal pattern starts to show.
After the hammer reinforces the reversal signal
The trading tip is to confirm with a bullish candle.
3. inverted hammer
Looks: Little body with long upper wick.
Importance: Appearance of a bullish reversal signal following a downturn.
Trading Tip: Wait for the confirmation from the next candle closing higher.
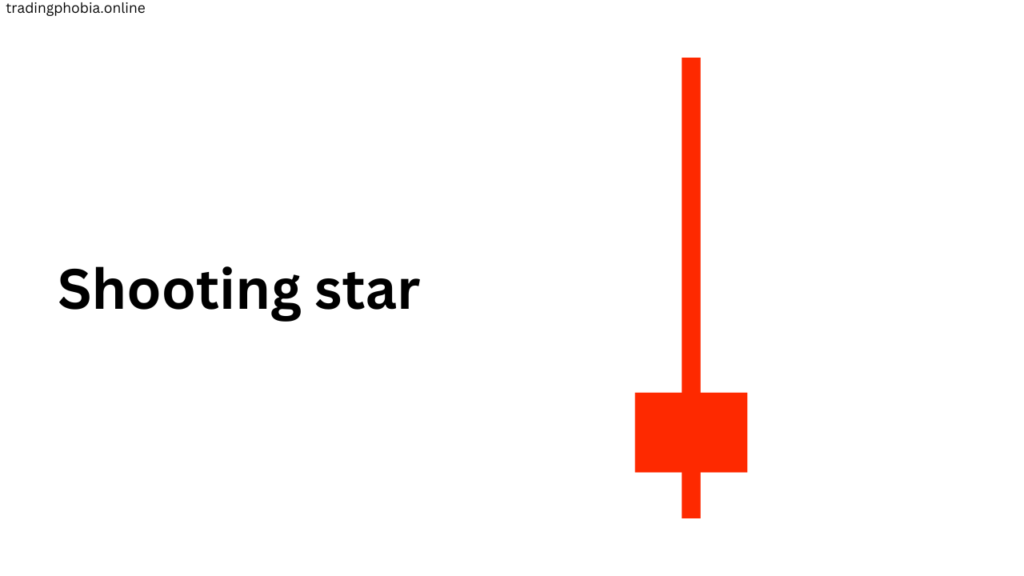
4: Shooting Star
Look: a small body with a lengthy upper wick, like an inverted hammer, but showing a following uptrend.
Significance: bearish reverse pattern.
Trading Tip: Reliability is raised by confirmation with a bearish candle.
5. The Hanging Man
Appearance: A small body with a long lower wick, resembling a mallet, that emerges following an upward trend.
Important: Signal of bearish reversal.
Trading Tip: The pattern is further supported by a robust bearish confirmation candle.
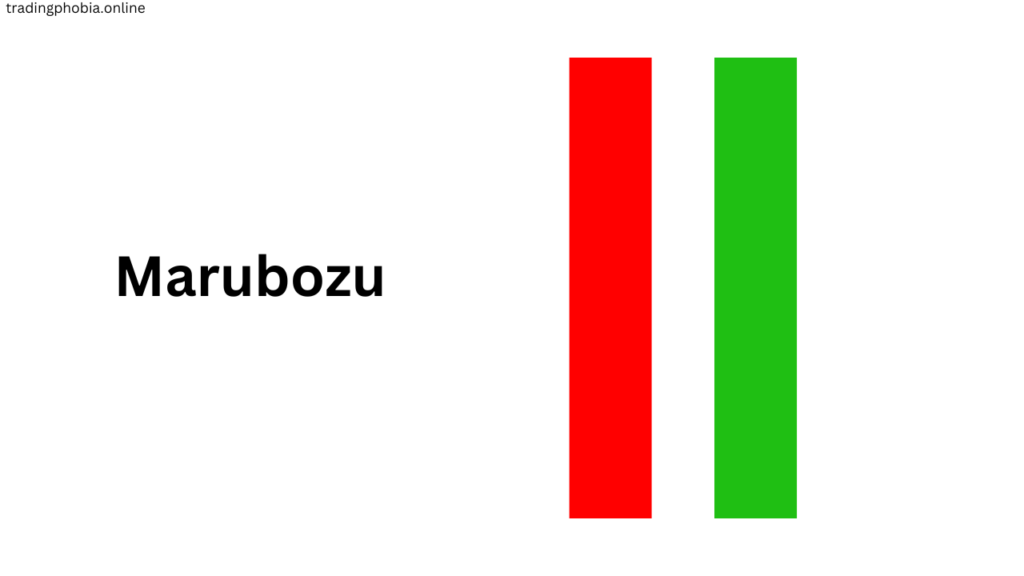
6. Marubozu
Appearance: A candle that is full-bodied and lacks filaments.
Types include:
- Bullish Marubozu: There is a significant upward trend.
- Bearish Marubozu: A powerful downward trend.
Significance: Demonstrates an excessive amount of purchasing or selling pressure.
Trading Tip: The occurrence of a trend continuation in the middle of a trend may serve as an indicator.
7. Spinning Top
Appearance: A compact body with extended upper and lower wicks.
Significance: Indicates potential reversal, continuation, or indecision, contingent upon the market context.
Trading Tip: Monitor confirmation flames to ascertain the direction.
An Overview of the Doji Candlestick Pattern
A Doji candlestick is a candlestick pattern that signifies market uncertainty. It is produced when the opening and closing prices of an asset are nearly equal, resulting in a small or nonexistent body with wicks (shadows) extending above and below.
This pattern indicates that purchasers and sellers are in equilibrium, and it may indicate potential trend reversals or continuations, contingent upon the context.
- The standard doji
A standard Doji is produced when the opening and closing prices of an asset are nearly identical, resulting in a small or nonexistent body with upper and lower shadows. This pattern exemplifies market indecision, in which neither buyers nor vendors have control.
The Standard (Neutral) Doji occurs when an asset’s opening and closing prices are almost comparable, resulting in a small body and equal-length wicks. It denotes market indecision, with neither buyers nor sellers dominating. This pattern frequently indicates a potential reversal but requires confirmation from the following candlestick for a clear direction.
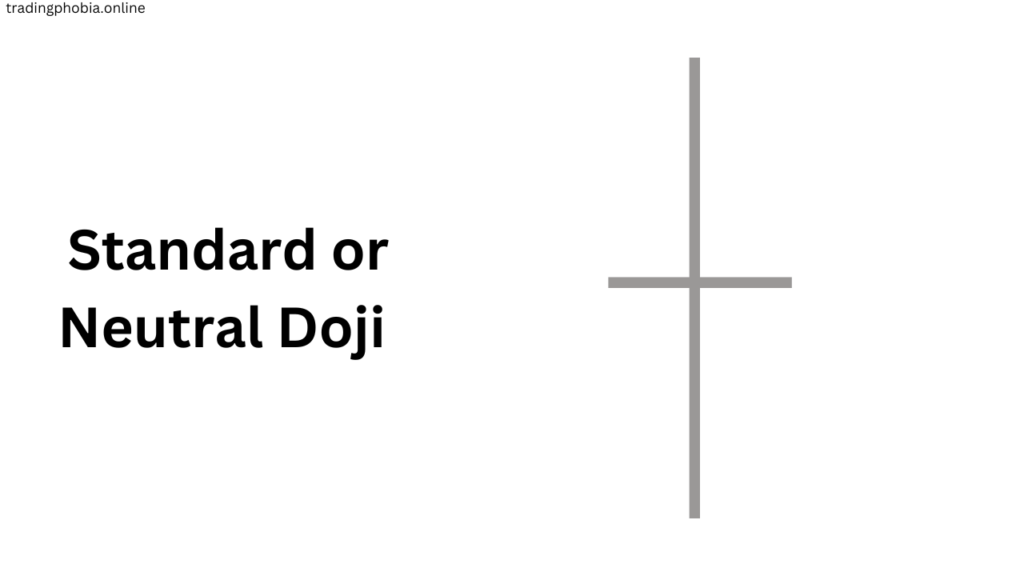
If it emerges subsequent to a robust trend, it may suggest a potential reversal; however, if it occurs in a sideways market, it merely confirms the current indecision. Traders frequently delay their actions until the subsequent candle confirms the direction.
- Doji with Long Legs
A long-legged Doji is distinguished by its long upper and lower flames, which indicate substantial price fluctuations during the trading session. This pattern indicates that both purchasers and sellers exerted considerable pressure on prices in both directions, but they ultimately were unable to establish a monopoly.
With extended upper and lower wicks, the Long-Legged Doji indicates great market volatility and hesitation. Although buyers and sellers drive prices in both directions, no side takes control, and a close near the opening price results. It usually shows before trend reversals or consolidations and needs confirmation for a clean indication.
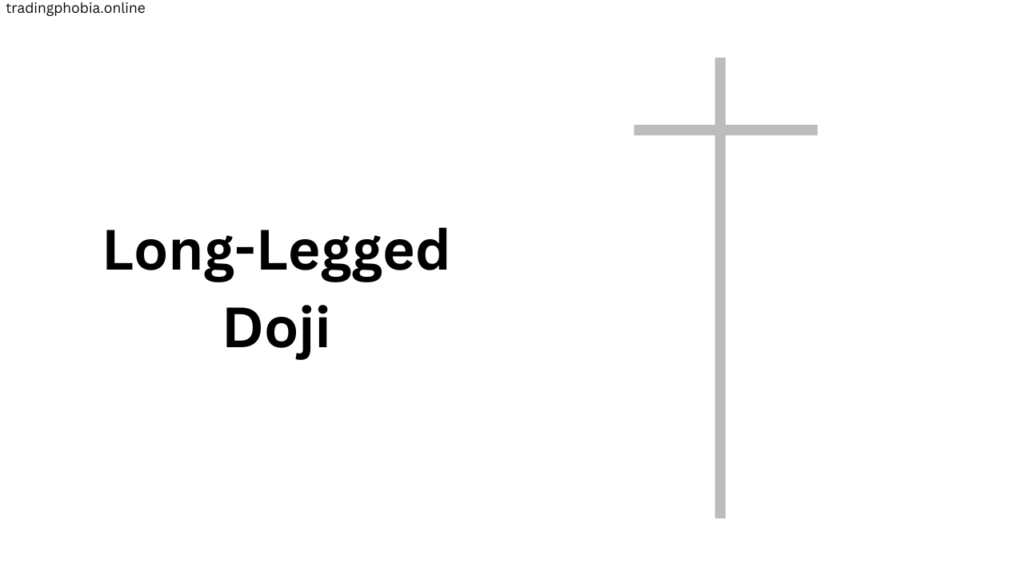
The extended wicks suggest an increase in volatility and uncertainty. This pattern may indicate a potential adverse reversal if it is observed at the apex of an uptrend. In contrast, it may indicate a prospective bullish reversal at the bottom of a downtrend; however, confirmation is required.
- Gravestone Doji
Gravestone The opening and closing prices of Doji are in close proximity to the session’s low, and it has a long upper wick and minimal to no lower wick. This pattern indicates that purchasers made an attempt to increase prices, but they were unsuccessful as sellers regained control, resulting in a decline in the price by the close.
The Gravestone Doji has a long upper wick and little to no lower wick, with the opening and closing prices near the low. It indicates strong selling pressure after buyers initially drove prices higher. When it appears at the top of an uptrend, it suggests a potential bearish reversal, requiring confirmation for validation.
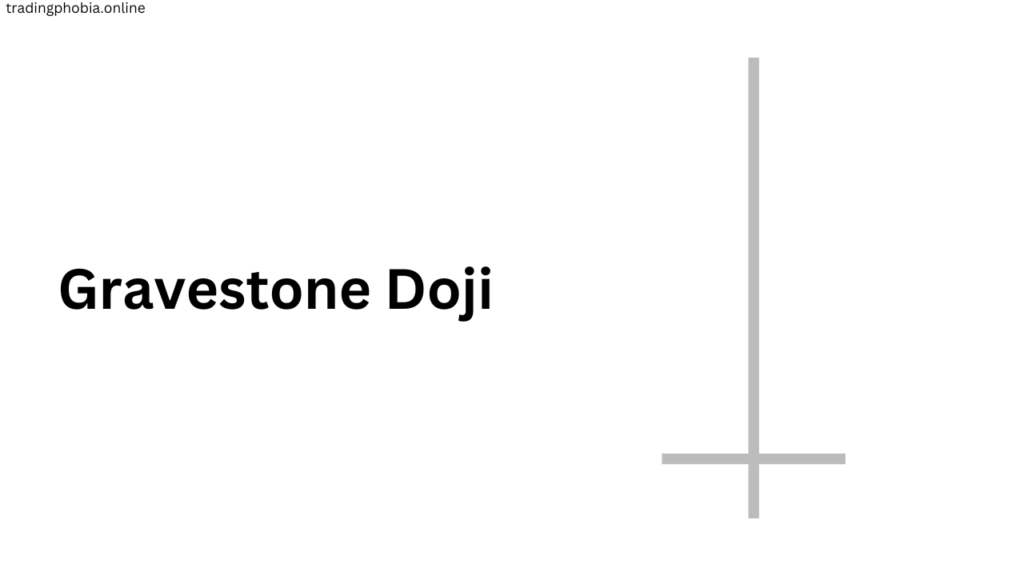
When it manifests at the summit of an upward trend, it is regarded as a potent adverse reversal signal. In order to validate the prospective downtrend, traders frequently seek confirmation in the form of a bearish candlestick that follows the gravestone Doji.
- Dragonfly Doji
A dragonfly The opening and closing prices of Doji are in close range to the session’s high, and it has a long lower wick and minimal to no upper wick. It suggests that sellers initially lowered prices; however, purchasers regained control and raised the price to the opening level.
The Dragonfly Doji is characterized by a long lower wick and minimal to no upper wick, with the opening and closing prices being near the high. It indicates that there is substantial purchasing pressure following the initial reduction in prices by sellers. It is indicative of a potential favorable reversal when it is observed at the bottom of a downtrend, but confirmation is necessary for validation.
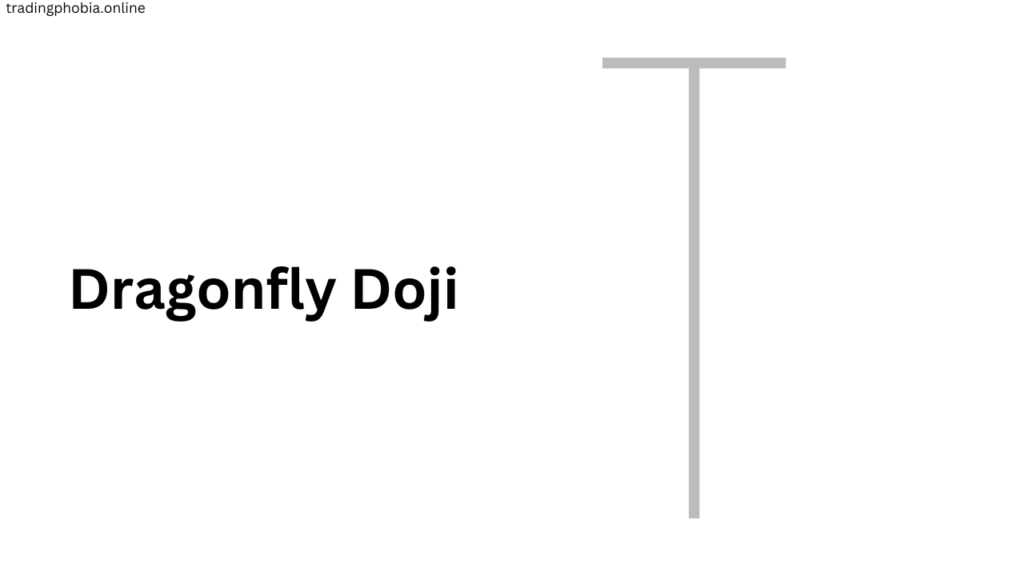
This pattern is frequently regarded as a favorable reversal signal when it is discovered at the bottom of a downtrend. In order to verify that the trend is indeed reversing, traders should await a confirmatory candle, such as a robust bullish candlestick.
- Four-Price Doji.
Four prices Doji is a candlestick pattern in which the open, close, high, and low prices all match, making a single horizontal line. This pattern represents great indecision, since neither buyers nor sellers were able to influence the price in any direction.
The Four-Price Doji is a unique candlestick pattern in which the open, high, low, and close prices are identical, resulting in a single horizontal line. It is indicative of minimal volatility and extreme market indecision. This pattern is frequently observed during periods of low volume and offers minimal directional insight in the absence of additional confirmation.

It is typical in low-volume trading sessions and provides little insight unless accompanied by a substantial price shift. Because of its scarcity and lack of volatility, it is not considered a solid trading indication unless it is accompanied by other technical indicators.
Hammer Candlestick Pattern: A Full Overview
The Hammer candlestick pattern is a bullish reversal signal that usually comes around the bottom of a downtrend. It has a little actual body near the top of the candle, a large lower wick (at least twice as long as the body), and little or no upper wick. This structure shows that sellers originally pushed the price lower throughout the trading session, but strong buying pressure moved it back up to around the opening price by the close.
A hammer indicates that the market may be shifting from bearish to bullish sentiments. However, for the pattern to be valid, traders frequently look for confirmation in the form of a big bullish candle following the Hammer. The extended lower wick signals rejection of lower prices, signaling that buyers are moving in.
Trading Hammer Candlestick
- A downtrend must precede the hammer to be considered a genuine reversal indicator.
- Volume analysis can improve signal strength; increased volume on the Hammer boosts reliability.
- A confirmation candle (a bullish candle closing above the hammer) is required before entering a trade.
- To manage risk, set a stop loss below the hammer’s low.
When the hammer emerges at important support levels, its bullish connotations become much more pronounced. To boost accuracy, traders should combine it with additional indicators like as RSI, MACD, or moving averages. 🚀
Complete Guide on Inverted Hammer Candlestick Pattern
Found at the bottom of a downtrend, the inverted hammer is a bullish reversal candlestick pattern. It features a little actual body close to the low of the candle, a long upper wick (at least twice the body’s size), and either very little or no lower wick.
This arrangement implies that, although buyers tried to raise the price during the session, selling pressure pulled it back down. Still, the ability of buyers to raise the price points is an early indicator of a possible trend reversal.
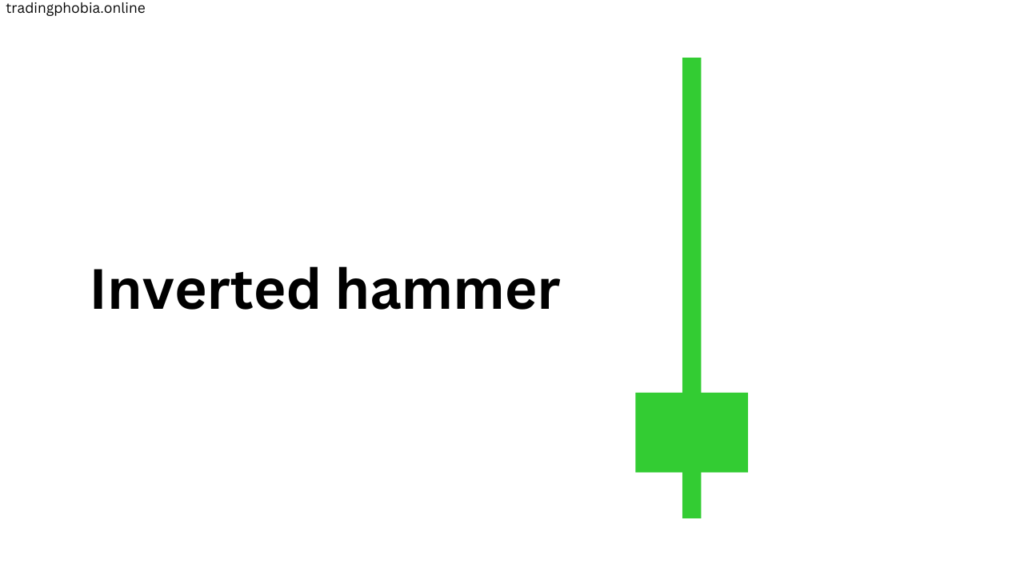
Unlike the Hammer, where the buying pressure is more immediate, the Inverted Hammer shows that buyers are probing resistance and might get control in the next sessions. Usually, waiting for confirmation in the shape of a powerful bullish candle following the inverted hammer, it closes close to its beginning price.
Trading inverted hammer candles
- Considered a bullish reversal indicator, it must show following a down trend.
- Its dependability rises with a huge trade volume on the inverted hammer.
- Before making a trade, one must confirm a bullish closing above the inverted hammer.
- To control risk, stop-loss falls below the low of the inverted hammer.
When paired with technical indicators like RSI and MACD or when it forms close to strong support levels, the inverted hammer is more successful. It indicates possible positive momentum but needs confirmation for a safer trade arrangement.
Complete Guide for Shooting Star Candlestick Pattern
Appearing at the pinnacle of an uptrend, the bearish reversal candlestick pattern known as The Shooting Star It has a little actual body close to the low of the candle, a lengthy upper wick (at least twice the size of the body), and either minimal or no lower wick. This arrangement shows that purchasers first raised the price, but close strong selling pressure drove it back down close to the starting price.
The Shooting Star says sellers are beginning to take over, and the uptrend may be losing strength. But since it closes close to its opening price, traders wait for a confirmation candle—typically a powerful bearish candlestick—usually following the shooting star to support the reversal.
Shooting Star Candlestick Pattern
- It has to show up following an uptrend as a legitimate bearish reversal indicator.
- Reliability of the shooting star rises with high trade volume.
- Before starting a short trade, one must confirm with a bearish close under the shooting star.
- To control risk, stop-loss comes above the crest of the shooting star.
When paired with technical indicators like RSI (overbought conditions) and MACD or when it occurs close to important resistance levels, the shooting star is more useful. It alerts buyers of possible selling pressure and a change in trend direction. 🚀.
Complete Guide on Hanging Man Candlestick Pattern
The Hanging Man is a pessimistic reversal candlestick pattern that manifests at the summit of an upward trend. It has a small actual body located near the top of the candle, a long lower wick that is at least twice the size of the body, and minimal to no upper wick.
This structure suggests that sellers drove the price lower during the session, but buyers attempted to recover, resulting in the price closing near the opening level. Nevertheless, the extended lower fringe indicates that the selling pressure is on the rise.
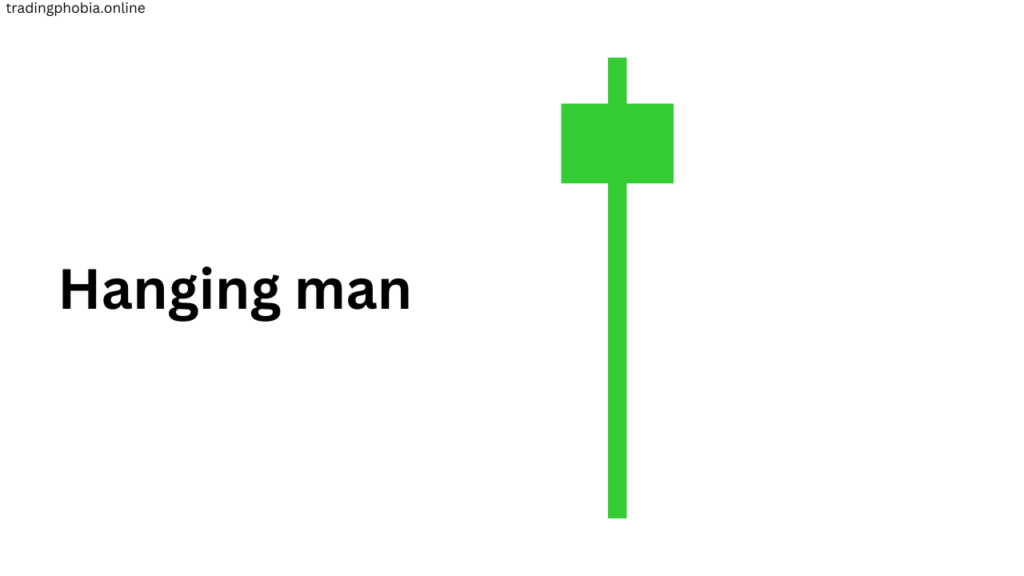
The Hanging Man implies that the uptrend may be losing momentum, and a potential adverse reversal may be imminent. Traders typically wait for confirmation in the form of a powerful bearish candle following the Hanging Man before making a trade decision, as the price managed to recover before closing.
Trading the Hanging Man Candlestick
- For a bearish reversal signal to be legitimate, it must occur following an uptrend.
- The Hanging Man’s reliability is enhanced by its high trading volume.
- Before engaging in a short trade, it is essential to observe a confirmation candle (bearish close below the Hanging Man).
- In order to mitigate risk, the stop-loss is established above the Hanging Man’s high.
The Hanging Man is more effective when it is formed near critical resistance levels or when it is combined with indicators such as MACD and RSI (overbought conditions). Although it indicates potential selling pressure, traders should delay their actions until they receive confirmation.
A Comprehensive Guide to the Marubozu Candlestick Pattern
The Marubozu candlestick pattern is a robust momentum indicator that, contingent upon its position on the chart, indicates either the continuation or reversal of a trend. The open and close prices of a Marubozu candle are at or near the high and low of the session, as they have either no wicks (shadows) or very tiny ones. Throughout the trading period, this structure suggests that either buyers or vendors have maintained a significant level of dominance.
Marubozu candles are classified into two categories:
1. Marubozu, who is bullish There are no upper or lower filaments on the candle, which has a long green (bullish) body. This implies that buyers were in complete control from the opening to the closing price, suggesting either a significant reversal from a downtrend or the continuation of an uptrend.
2. Marubozu, who is bearish The candle lacks both upper and lower wicks and features a long, crimson (bearish) body. This indicates that sellers maintained control over the market for the duration of the session, which could indicate the continuation of a downtrend or a reversal from an uptrend.
Trading Marubozu Candlesticks
- In an uptrend, a bullish Marubozu indicates that the trend will continue, whereas in a downtrend, it indicates a prospective reversal.
- In a downtrend, a bearish Marubozu suggests that the trend will continue, whereas in an uptrend, it suggests that the trend will reverse.
- The Marubozu candle’s credibility is enhanced by high-volume analysis, which can bolster the signal.
- In order to mitigate risk, a stop-loss can be implemented at the opposite end of the Marubozu candle.
The Marubozu is a candlestick pattern that is highly effective, as it signifies a significant amount of purchasing or selling pressure. In order to enhance its accuracy, traders frequently employ it in conjunction with **support/resistance levels** and technical indicators such as RSI and MACD.
A Comprehensive Guide to the Spinning Top Candlestick Pattern
The Spinning Top is a neutral candlestick pattern that denotes market uncertainty. It is characterized by a tiny, real body situated in the center of the candle, as well as long, comparable-length upper and lower wicks. This structure suggests that both buyers and sellers endeavored to regulate the market throughout the session; however, neither party achieved a clear advantage, leading to a close that was comparable to the opening price.
The Spinning Top can be observed in both uptrends and downtrends. Depending on the validation from the subsequent candlestick, the formation of this pattern following a strong trend may indicate a potential slowdown or reversal. Nevertheless, if it is observed in a sideways market, it is merely indicative of the ongoing indecision.

Trading Spinning Top Candlesticks
- If followed by a bearish candle, a pinning top in an uptrend may indicate trend exhaustion and a potential reversal.
- If the spinning top is confirmed by a bullish candle, it may suggest seller weakness and a potential bullish reversal in a downtrend.
- The pattern can be further emphasized by a high trading volume.
- Depending on the direction of the transaction, the stop-loss should be positioned near the high or low of the spinning top.
Support/resistance levels and technical indicators such as RSI or MACD are most effective when combined with the Spinning Top. Although it indicates market uncertainty, traders should consistently seek confirmation candles prior to making a trade decision.
Single candlestick Pros & Cons
Pros
- Simple to Identify—Single candlestick patterns are easily identifiable on a chart, making them accessible to traders of all skill levels.
Quick Trading Signals—These patterns offer immediate insights into potential trend reversals or continuations without the necessity of multiple wicks.
Operates Across Timeframes—They are capable of being implemented in a variety of timeframes, including long-term trading strategies and intraday charts.
Improves Entry and Exit Timing—When employed in conjunction with other technical indicators, single candlestick patterns assist traders in executing well-timed entries and exits.
Market Sentiment Can Be Indicated—These patterns can be used by traders to determine whether purchasers or sellers are in control, thereby assisting them in assessing market psychology.
Cons
- Lack of Confirmation—A single candle is rarely dependable; traders must wait for confirmation from the following candle or other indications.
Single candlestick patterns are more likely to produce erroneous indications, particularly in choppy or sideways markets.
Less Reliable in Isolation—They perform best when paired with support/resistance levels, volume analysis, or trend indicators (such as RSI and MACD).
Not Strong in Strong Trends—In a strong uptrend or downtrend, reversal patterns such as Doji or Hammer may not always produce an actual reversal.
Market Manipulation Risks In low-volume markets, unexpected price spikes can produce misleading patterns that do not reflect genuine market sentiment.
Conclusion on Single Candlestick Patterns
Single candlestick patterns are effective technical analysis tools that provide insight into market mood, price activity, and future trend reversals or continuations. Traders frequently employ patterns like the Hammer, Inverted Hammer, Shooting Star, Hanging Man, Doji, Marubozu, and Spinning Top to analyze buying and selling pressure. Their simplicity makes them easy to recognize, allowing both new and experienced traders to use them in their strategies.
One of the most significant advantages of single candlestick patterns is their ability to generate speedy trade signals. They provide rapid visual cues about the strength or weakness of the current trend, allowing traders to make fast decisions.
These patterns are adaptable, operating across a variety of timeframes and market situations. They also serve as an important component of price action trading, removing the need for sophisticated technical indicators.
Regardless of its value, single candlestick patterns have limitations. Their main disadvantage is a lack of confirmation, which makes them unreliable if utilized alone. They frequently produce erroneous signals, particularly in range or turbulent markets where price changes are common.
To improve accuracy, traders must use them alongside other technical tools such as volume analysis, support and resistance levels, RSI, and MACD.
To summarize, while single candlestick patterns can provide valuable insights into market psychology, they should not be used as the primary foundation for trading choices. The ideal method is to combine them with other indications and always wait for confirmation before making a transaction.
Understanding their strengths and shortcomings allows traders to successfully incorporate these patterns into a holistic trading strategy, resulting in better risk management and profitability.