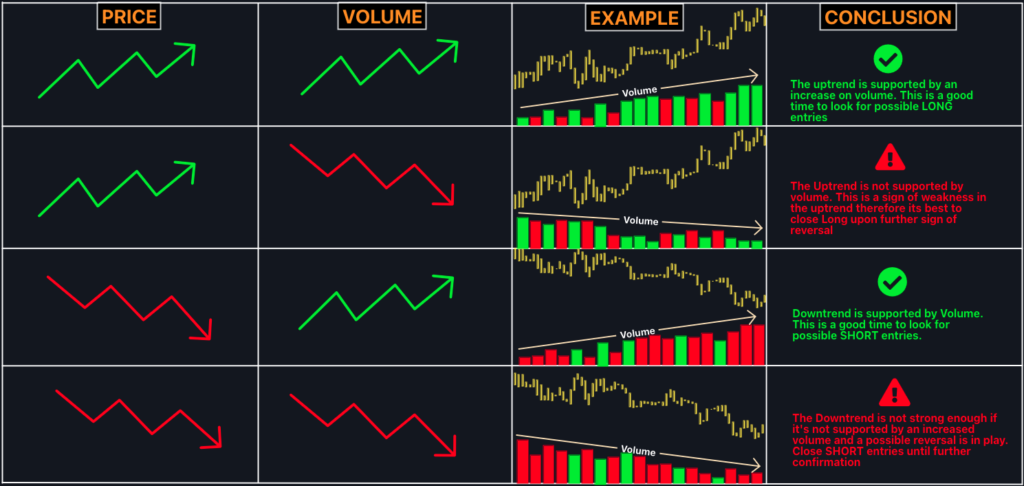
Volume Divergence in Trading occurs when an asset’s price moves in one direction while the trading volume moves in the opposite direction. Falling prices with high volume typically indicate strong selling pressure, while rising prices with increasing volume typically indicate strong buying interest.
Bullish Divergence in Volume:
While the price is declining, the volume is rising or remaining stable. This may indicate that buyers are taking over and selling pressure is waning, which could portend an upward price reversal.
Divergence of Bearish Volume:
Volume is declining, but the price is increasing. Given that fewer traders are backing the rally, this implies that the upward move may be waning. A price decrease might ensue.
As a sign that the current trend may be about to shift, traders keep an eye out for volume divergence. It is frequently used with other indicators to identify false breakouts or validate possible reversals.
How Does Trading Volume Occur?
In trading, “volume” refers to the total number of shares, contracts, or lots that are traded for a particular asset over a specified period. Consider it the market’s “heartbeat”—it demonstrates the volume of activity that goes on behind price changes.
What Causes Volume?
There is only one simple explanation for volume: people are buying and selling. There’s more to it, though! What determines volume is as follows:
Participants in the Market:
Volume is determined by the number of trades that occur whenever a buyer and a seller agree on a price. These could be day traders, large institutions, or even trading algorithms.
Events & News:
A spike in volume can be brought on by major news, such as economic data releases, earnings reports, or geopolitical events. More buying and selling occurs as a result of traders’ quick responses to new information.
Key Levels & Breakouts:
Volume frequently increases when prices reach significant levels, such as trendlines, resistance, or support, as traders rush in to defend a position or catch a breakout.
Market Attitude:
Depending on whether investors are bearish or bullish, a surge in trading activity may result, in increasing volume.
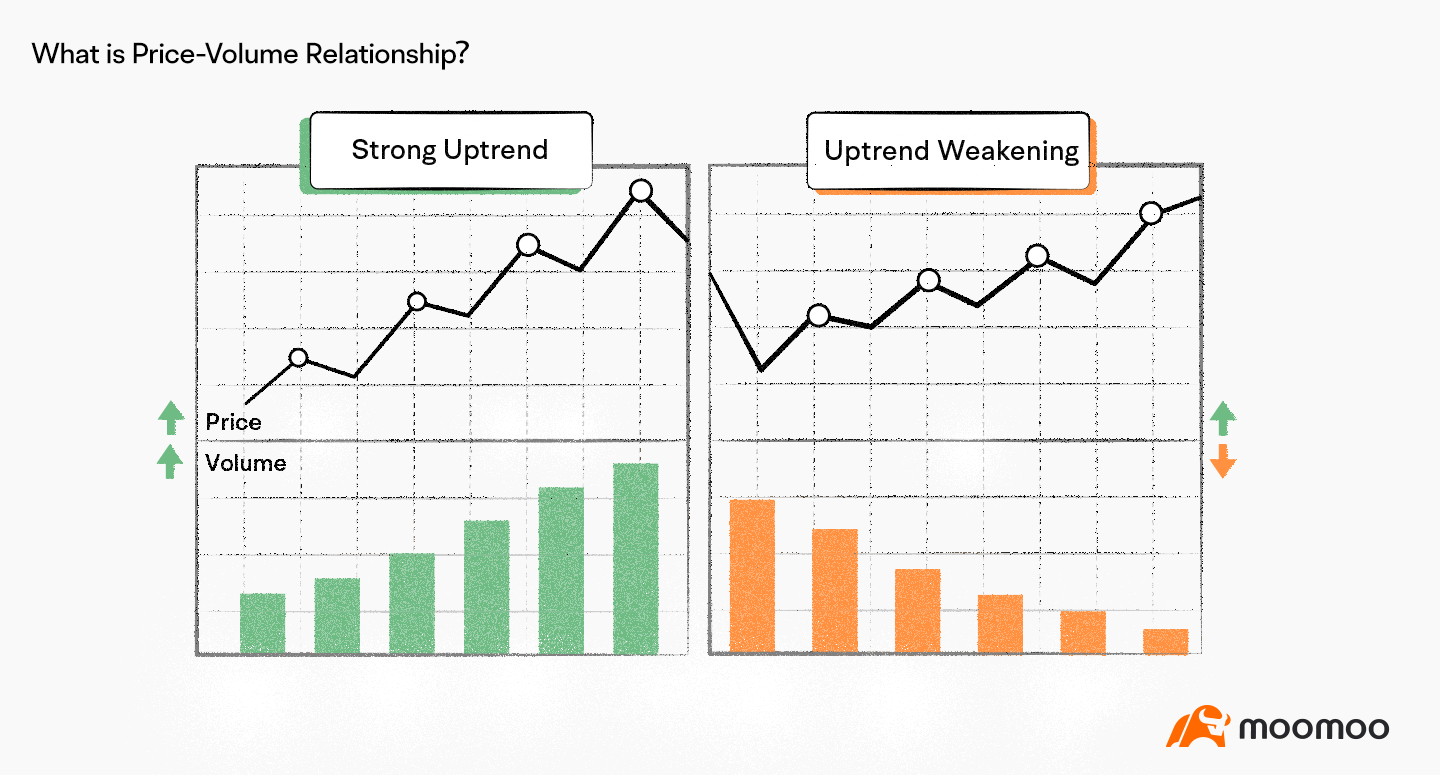
What Makes Volume Important?
The strength or weakness of price movements can be inferred from volume. For instance:
Strong Uptrend = High Volume + Price Increase
Price decline plus high volume equals a strong downtrend.
A weak or unclear trend is indicated by low volume moves.
Traders frequently use volume to identify false breakouts, identify possible reversals, and validate trends.
A Brief Visual Guide:
Consider a situation where the price of a stock is rising but there is little trading activity (low volume). That might indicate that the move is unreliable.
Now, it indicates genuine interest and strength behind the move if the price increases AND there is a lot of trading going on (high volume).
Types of Trading Volume
Not every volume is made equally! The following are some important volume types that traders keep an eye on:
Volume Tick:
This counts how many price adjustments (or “ticks”) there are in a specific time frame. Even if the precise number of shares traded isn’t displayed, more ticks frequently indicate greater activity.
Volume of Trade:
This is the most popular kind; it displays the total quantity of contracts or shares that were exchanged during a given time frame. Strong interest in that asset is typically indicated by a high trade volume.
Volume of Purchases and Sales:
This divides the volume into activities related to buying and selling. It assists traders in determining whether the market is dominated by buyers or sellers.
Price by Volume:
This aids in identifying support and resistance zones by displaying the volume that has occurred at various price levels.
OBV, or on-balance volume:
This technical indicator measures the strength of a trend by adding volume on days when prices are rising and subtracting it on days when prices are falling.
A Volume Strategy: What Is It?
When trading, a volume strategy makes well-informed decisions about asset purchases and sales by utilizing volume data. Volume can offer important hints about market trends, strength, and possible reversals since it indicates the amount of activity and interest in an asset.
A few well-liked volume strategies are as follows:
Volume Breakout Strategy:
Traders watch for a price breakout above resistance or below support in conjunction with an abrupt increase in volume. A high volume indicates that the breakout is probably robust and long-lasting.
Identify the Setup:
Start by locating important levels of support or resistance on a price chart. The price has previously had difficulty moving above (resistance) or below (support) these areas.
Keep an eye out for volume spikes:
Watch the volume when the price gets close to these levels. Strong buying or selling interest is indicated by a breakout with high volume, which validates that the move is probably real.
Let’s Get Started:
Your signal to enter is when the price breaks above resistance (for a bullish trade) or below support (for a bearish trade) with high volume. The volume indicates that there is momentum behind the breakout, acting as a green light.
Strategy for Volume Divergence:
This tactic finds price and volume discrepancies. A weakening trend and potential reversal may be indicated, for instance, if prices are increasing but volume is declining.
VWAP, or volume-weighted average price:
The Volume-Weighted Average Price, or VWAP, is a helpful trading guide. It is the average price, weighted by volume, at which a stock has moved during the day. Think of it as a stock’s “real” price, taking into account the volume of trading activity at each price point.
VWAP is frequently used by day traders as a benchmark to determine the current state of the market, whether it is trending upward or downward. The stock is regarded as being in an uptrend if the price is above the VWAP and in a downtrend if it is below. It functions similarly to determining whether or not the stock is “in favor” of the market.
Additionally, it aids in trend confirmation. Price movements above VWAP are considered good buy signals, while price movements below VWAP may indicate a good time to sell.
The best part, though? It resembles a dynamic line of support and resistance. Prices frequently bounce off of VWAP, particularly on a day with a lot of volatility, and it can assist traders in determining when to enter or exit the market.
Therefore, VWAP provides you with a clear point of reference to keep up with the beat of the market if you’re looking to trade!
VWAP calculates an asset’s average price by combining price and volume. It is used by traders to assess whether an asset is oversold or overbought about the average.
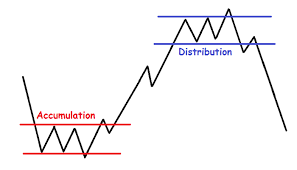
Strategy for Accumulation and Distribution:
The terms “accumulation” and “distribution” in trading refer to the stages of market buying and selling activity. These stages frequently assist traders in determining whether an asset’s price is likely to rise or fall.
In general, accumulation describes the time when smart money (institutional investors, seasoned traders) buys an asset covertly before a price increase, whereas distribution describes the time when the same investors sell or offload their holdings prior to a price decline.
This is a calculated strategy for both:
Accumulation Plan (Purchase Stage)
When the market is undergoing consolidation, usually following a downward trend, accumulation takes place. It can be recognized by:
Stability of Price:
Following a downward trend, the price either begins to level off within a specific range or experiences slight price increases.
Patterns of Volume:
Accumulation is frequently linked to higher volume at lower price points. It suggests that bigger companies are stealthily joining the market.
Verification of Indicators:
To spot oversold situations or consolidation zones, use indicators like Bollinger Bands, the Relative Strength Index (RSI), or Moving Averages (MA).
Patterns in Charts:
Keep an eye out for bullish reversal patterns like higher lows, inverse head and shoulders, or double bottoms.
Signals of Accumulation Entry:
Watch for a break above the consolidation zone’s resistance, which would suggest that buyers are taking charge.
Make use of volume confirmation:
The accumulation phase is probably over and a new uptrend is beginning when the price increases with volume.
Use trend-following instruments such as MACD or Moving Average Crossovers to verify bullish momentum.
An example of a strategy
Purchase on Breakouts: When the price breaks above significant resistance following a lengthy consolidation with high volume spikes, enter the market.
Risk Control:
To guard against false breakouts, place a stop loss below recent support levels, which should be slightly below the consolidation range.
Traders can forecast future price movements by determining whether a stock is being distributed (sold) or accumulated (bought) by combining price and volume analysis.
Distribution Plan (Selling Stage)
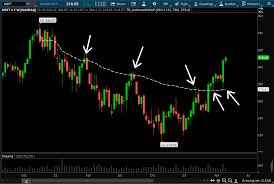
Distribution usually happens when the market is getting ready for a reversal following an extended uptrend. It can be recognized by:
Exhaustion of Prices:
Although the price hits new highs, the momentum begins to wane. This may manifest as long-term sideways movement or diminishing price increases.
Patterns of Volume:
Growing volume frequently coincides with distribution as bigger players liquidate their holdings.
Verification of Indicators:
conditions of overboughtness (RSI > 70) and price-indicator divergence (e.g., price reaches new highs, but RSI reaches lower highs).
Patterns in Charts:
Keep an eye out for bearish reversal patterns like lower highs, head and shoulders, or double tops.
Signals for Distribution Exit:
When the price begins to move below important support levels or exhibits volume-confirmed reversal, it is time to sell.
To confirm bearish momentum, use trend-following tools such as MACD or Moving Average Crossovers.
Strong selling pressure is typically indicated by a notable volume spike during a decline, which is a typical distribution indicator.
An example of a strategy
Sell when it breaks down:
Sell when the price drops below a significant support or accumulating range, as this indicates that the distribution phase is over and a decline is likely.
Risk Control:
To lock in profits and modify them as the price declines during the distribution phase, use trailing stops.
Accumulation and Distribution Strategy Together:
Combining the two stages can be a potent strategy to increase profits:
Determine Accumulation:
Start by buying in at lower levels and entering trades during the accumulation phase.
Determine Distribution:
Exit the positions as soon as the price begins to exhibit distributional indicators, such as slower upward movement, holding resistance levels, and bearish chart patterns.
Combine Indicators:
For increased accuracy, combine volume analysis with momentum indicators such as MACD or RSI.
Use Timeframes to Diversify:
To obtain a more comprehensive perspective, use both short-term (for distribution) and long-term (for accumulation) charts.
Strategy for Volume Pullback:
Finding opportunities when the price retraces (pulls back) with decreasing volume is known as a volume pullback strategy in trading. This suggests that the main trend may continue once volume resumes its upward trajectory. This is a methodical approach:
Determine the Primary Trend
The 50, 100, and 200 EMA/SMA moving averages can be used to identify whether a trend is bullish or bearish.
Seek out lower highs and lower lows (downtrend) or higher highs and higher lows (uptrend).
Seek a Retraction
a decline in price from the primary trend.
This pullback should ideally be on decreasing volume, which would indicate a weaker countertrend.
Finding important levels for a possible reversal can be aided by Fibonacci retracements (38.2%, 50%, and 61.8%).
Await confirmation of the volume.
When the price returns toward the trend, look for a volume increase as the pullback approaches a moving average or support/resistance level.
A volume increase verifies the continuation of the trend.
Make a Trade at the Appropriate Time
It is a bullish trade when the price bounces off support with increasing volume.
When the price rejects resistance with rising volume, it is a bearish trade.
The entry signal is strengthened by candlestick confirmation, such as an engulfing candle, hammer, or pin bar.
Prevent Loss and Make Profit
Set your stop-loss just above the high (for short) or low (for long) of the pullback.
Determine a risk-reward ratio of at least 1:2 by using Fibonacci extension levels or previous swing highs and lows.
Observe and Leave Wisely
Profits can be locked in by using a trailing stop-loss.
After a breakout, if volume starts to decline again, lower your position.
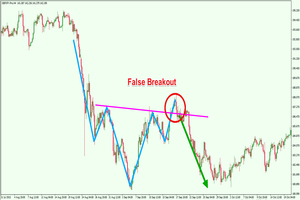
How to Spot False Trading Volume Momentum
Avoiding false breakouts and traps set by market manipulators (such as smart money, institutions, or market makers) requires the ability to recognize fake volume momentum in trading. Here’s how to recognize phony volume momentum and steer clear of losing trades:
Volume vs. Price Action Discrepancy
False Volume:
It could be a sign of manipulation or a lack of genuine interest if volume increases but the price hardly moves or moves against expectations.
Actual Momentum:
Strong volume should lead to a strong price movement in the expected direction.
For instance:
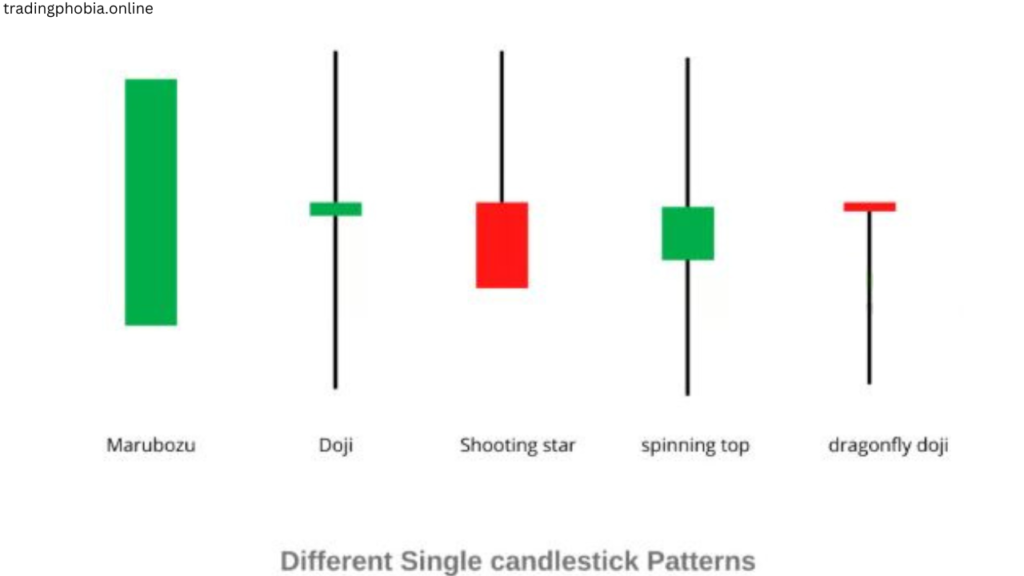
Fake momentum occurs when a stock exhibits a large volume spike but closes with a small candle (doji, spinning top, or weak body).
A stock breaks resistance with a big volume spike and a large bullish candle → Real breakout.
Key Level Volume Clusters (Smart Money Absorption)
False Volume:
It may be smart money buying (accumulation) or selling (distribution) if volume increases close to resistance or support but the price does not break out.
Actual Momentum:
A breakout with consistently high volume should have follow-through; otherwise, it’s a fake move.
For instance:
A stock approaches resistance with high volume but does not break out → There is an offload of smart money.
Real momentum occurs when a stock breaks resistance, retests with low volume, and then rises with high volume.
Unexpected Volume Increases Without Trend Verification
False Volume:
It could be a trap if volume jumps abruptly without any discernible trend continuation.
Actual Momentum:
Instead of a single spike, a true trend continuation should have consistent volume growth.
For instance:
A haphazard increase in volume on a sideways market with no significant price movement → Fake.
As the price moves in one direction → Real, volume steadily increases.
Unusual Volume Before or After Market
Fake Volume: In order to deceive retail traders, market makers may fabricate volume before or after business hours.
Real Momentum: With institutional participation, true momentum ought to emerge during regular trading hours.
Volume Divergence (No Follow-Through on Breakouts)
Fake Volume: If price breaks out but volume dries up right after, the breakout is likely fake.
Real Momentum: Following a successful breakout, the volume should continue to rise.
For instance:
When a stock spikes in volume, it immediately declines on low volume → Fake.
Strong bullish candles and sustained high volume follow a breakout → Real.
Manipulation of Time and Sales (Order Flow) Look out for:
Spoofing:
Big orders show up but vanish before being carried out.
Wash Trading:
Buying and selling repeatedly to create a false volume.
Order book stacking is the practice of placing large buy/sell orders that are never filled.
Use volume indicators to determine whether the price movement is in line with actual buying or selling pressure. The last tip is to use On-Balance Volume (OBV).
Volume Weighted Average Price (VWAP): A price that deviates significantly from VWAP during periods of low volume may be fraudulent.
Smart money may be selling if the price increases but the Accumulation/Distribution Line (A/D) decreases.
Volume Divergence in Trading – FAQs
In trading, what is volume divergence?
When the price moves in one direction but the volume does not support it, this is known as volume divergence. This frequently indicates a waning trend or possible reversal.
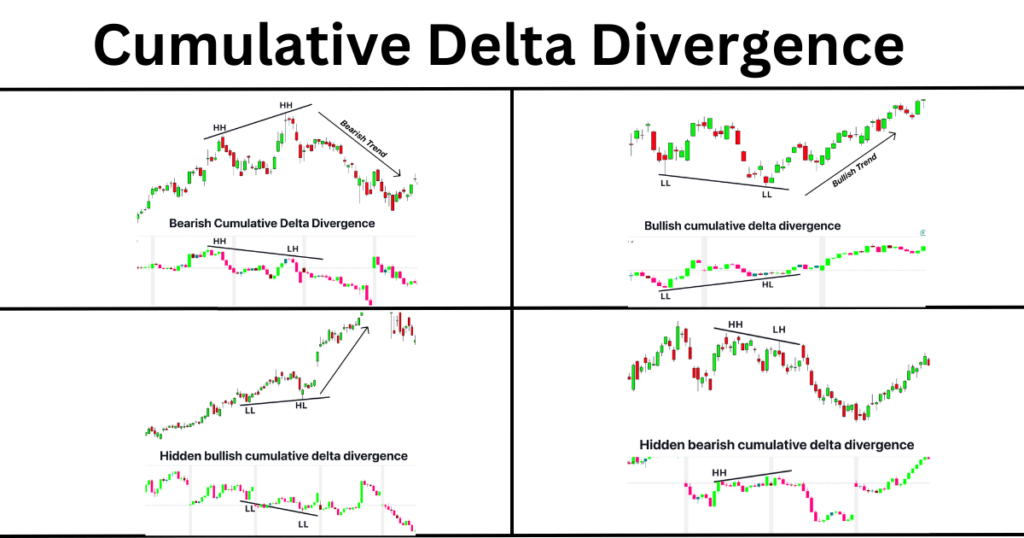
How Can Volume Divergence Be Spotted?
Bullish Divergence: A possible upward reversal is indicated when the price makes a lower low but the volume is declining.
A bearish divergence occurs when the price reaches a higher high but the volume is declining, indicating that the upward trend is waning.
What Causes Volume Divergence?
It happens as a result of smart money leaving the position or a lack of market participants backing the current price direction.
Which Indicators Are Useful for Identifying Volume Divergence?
On-Balance Volume (OBV): A decrease in OBV while a price increase indicates weak buying power.
The Accumulation/Distribution Line (A/D) indicates that smart money is selling if prices rise but A/D declines.
A tool for comparing volume trends to price action is the volume oscillator.
How Can Volume Divergence Be Traded?
For bullish divergence, look for a trend reversal pattern to validate entry, such as a double bottom, RSI divergence, or a bullish engulfing candle.
When a bearish candlestick pattern forms or the price rejects at resistance, take into consideration shorting.
Is Volume Divergence Effective in Every Timeframe?
Indeed, but:
Short timeframes (1 m, 5 m, and 15 m): Higher false signals and more noise.
Signals with higher timeframes (1H, 4H, and daily) are more dependable.
Does Volume Divergence Provide Inaccurate Indications?
Indeed. Divergence can occasionally happen, b ofut the trend still persists because
external stimuli, such as Fed decisions, earnings, and news.
Buying and selling by institutions is concealed in dark pools.
How Can a Trade Be Confirmed Best?
Make use of several confirmations:
Technical indicators (RSI, MACD, and moving averages); price action (candlestick patterns, support/resistance); and market structure (breakout/retest patterns)